All Activity
- Today
-
Hello Giancarlo, Do you have a valid license ? because this is one of the limitation of the DEMO mode. If you do have a license; please send us your logs at support@pvsyst.com: Regards; Laurent
-
I have a question: is it possible to set a layout zone and automatically fill it with the east-west table arrangement?
-
any updates on how to get around the demo version?
-
 Thomas joined the community
 -
 TSANTA RAMILISON joined the community
 -
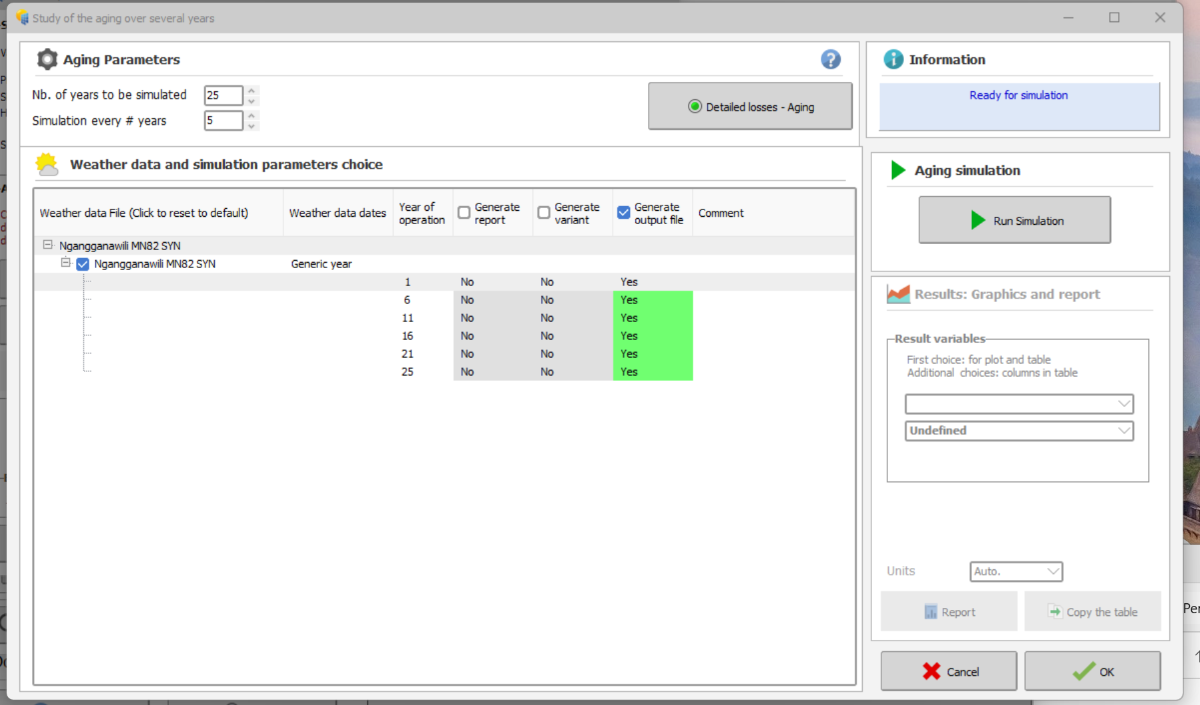
 Hi, I have modelled a solar farm installed 5years back and factored in the yearly degradation rates in the detailed losses>>aging section and enabled output file generation as attached below. For some reason, when I run the advanced simulation, it returns only Y1 E-grid values. How do I generate an output file with the hourly E-grid values for the current year, and later years? Thanks, Tonderai.
-

Why are diffuse integrals calculated for every run?
LauraH replied to LauraH's topic in Shadings and tracking
That would be great. - Yesterday
-
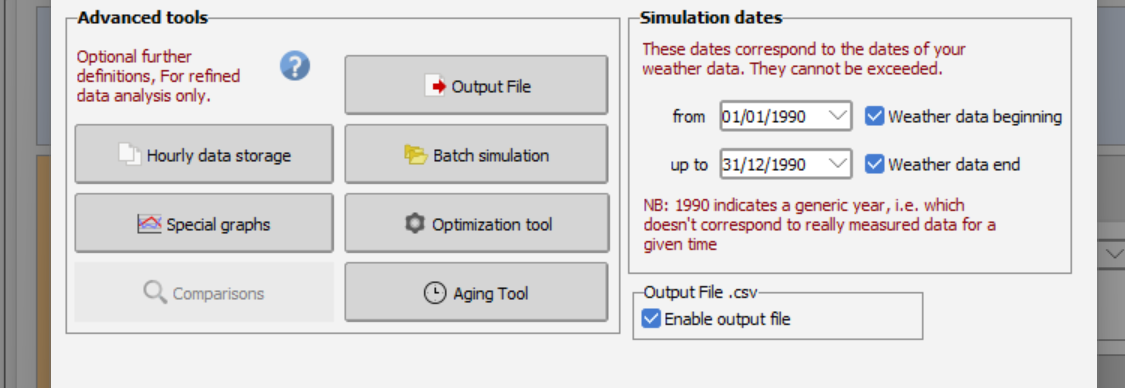
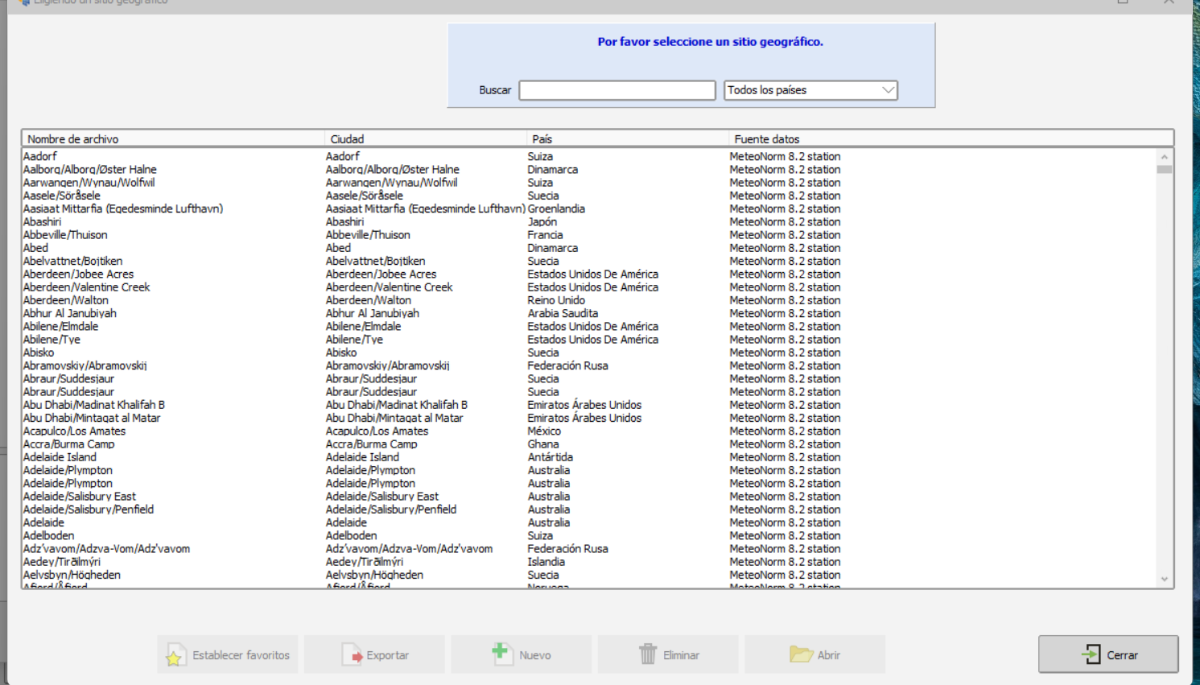
Hola a todos, favor su ayuda. No puedo agregar un nuevo sitio en pvsyst, me aparece como deshabilitado la opción Nuevo
-
 Giancarlo joined the community
 - Last week
-
 cloudwalker joined the community
 -
 outboardmotors3 joined the community
 -
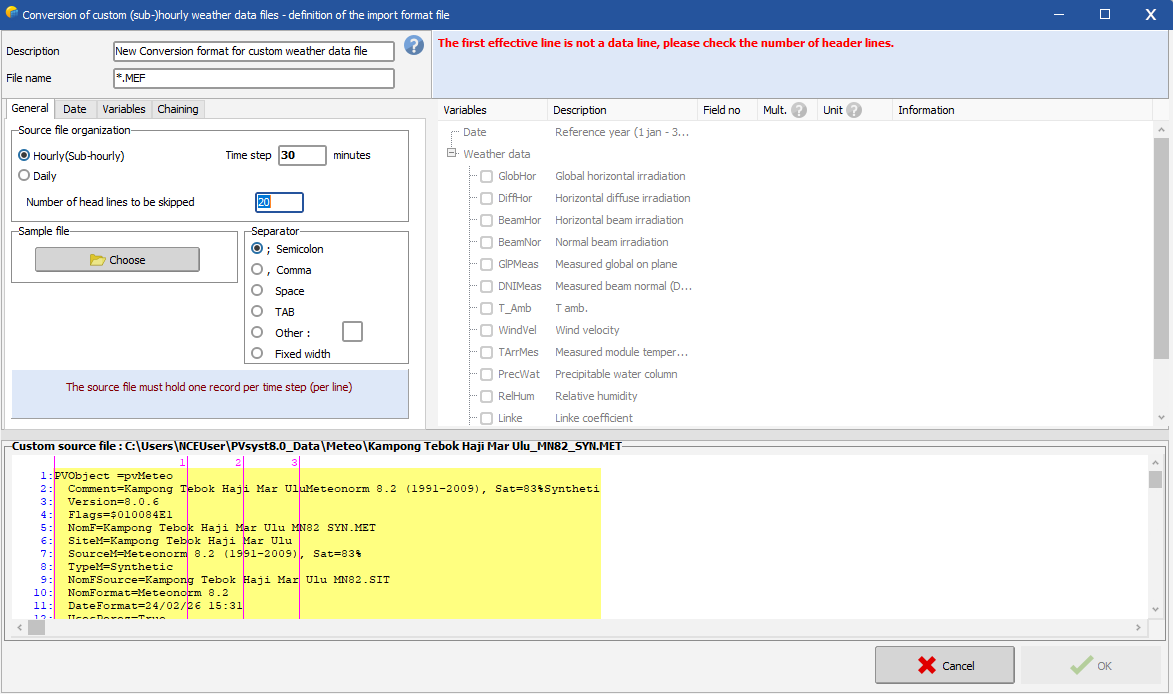
Hello, You should define the number of lines to be skipped, before the line where the (sub)hourly data starts. The general procedure for importing a custom weather data file is described in the following link: https://www.pvsyst.com/help/meteo-database/import-meteo-data/custom-meteo-files/conversion-protocol.html Note that you in this tool are supposed to import a a .csv file with (sub)hourly data, thus one line per time step with irradiance and temperature data and convert the .csv file to a .MET file that you can use in PVsyst to run your simulation. It seems like your source file is already a .MET file with Meteonorm 8.2 (hourly) data. You cannot re-convert an hourly .MET file to include the clipping correction.
-

Albedo shading component calculation
Linda Thoren replied to ClaireWest's topic in Shadings and tracking
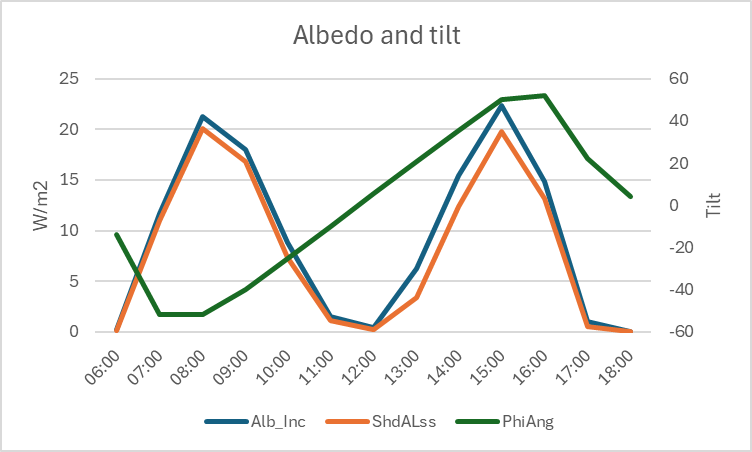
Hi, The shading calculation is indeed explained in the second link you have attached. In general, the higher the tilt, the higher the albedo contribution. Most of the albedo contribution will directly be lost (you see that the albedo loss is indeed following the albedo contribution) since we assume that only the first row is "seeing" the albedo, so that the albedo shading factor will be (n-1)/n (n = number of sheds). The albedo loss is a significant contribution to the global shading losses. -
 surronbuilds33 joined the community
 -
Hi, I am in process of applying the sub-hourly clipping and been following the instruction from INSTRUCTIONS FOR PREPARATION OF PAPERS, but i seem stuck at "the first effective line is not a data line, please check the number of header lines" Which data line should i refer? Do anyone have a video tutorial of enabling the sub-hourly clipping
-
 Haziq joined the community
 -
 Shahrul Aziq joined the community
 -

Why are diffuse integrals calculated for every run?
dtarin replied to LauraH's topic in Shadings and tracking
It would be helpful to include this in the next update. We've had to use custom tracker approximations to avoid long waits for diffuse recalculations when making other unrelated model updates. -
Hi, how is the albedo shading component (ShdALss) calculated? I have read the help pages on this topic but i am still not clear how this functionally works, sorry. https://www.pvsyst.com/help/project-design/shadings/calculation-and-model/index.html https://www.pvsyst.com/help/project-design/shadings/calculation-and-model/treatment-of-the-albedo-component.html#far-shadings Why does the albedo shading loss have this profile on a clear-sky day (single-axis tracking system): ? TIA
-
 craftsmanstorage joined the community
 -
 BENYAMIN joined the community
 -
Why is the diffuse shading information computed for every run, unlike the direct shading? Can't this information at least be held in the active memory as long as you're working on the same variant? I'm tweaking my loss terms and every time I rerun, PVsyst takes the time to build the diffuse integrals again. I can understand if you don't want to save it in the export, but while you're working would be nice. Thanks.
- Earlier
-
Consideration of .PAN Parameters in Mixed Module Simulations
Linda Thoren replied to Elise's topic in Simulations
The low light performance and temperature coefficient is defined in the individual .PAN files. The thermal parameters are then set for the full system to evaluate the temperature and the thermal losses in each sub-array. Thus if you are mixing panels in the same inverter (though in different sub-arrays), the different temperature coefficient of the different modules are well taken into account. In the loss diagram you will see the results for the full system. You find more information on the subject in the following PVsyst help pages: https://www.pvsyst.com/help/physical-models-used/pv-module-standard-one-diode-model/index.html?h=pv+module+standard+one+diode+model https://www.pvsyst.com/help/project-design/array-and-system-losses/array-thermal-losses/index.html -
Hello, As you indicate, in PVsyst you will first find the irradiance loss (linear shadings) and then the additional electrical shadings. Note that, in the loss diagram, each loss is defined as percentage of the previous energy quantity. Therefore the percent values are not additive.
-

Multi-Year Analysis of Inverter Clipping Losses & Module Degradation
ASZulu replied to ASZulu's topic in Simulations
Hi all, Thank you so much for the prompt and helpful responses! After reading the PVsyst documentation and your feedback, I understand and am happy with the output. -
Multi-Year Analysis of Inverter Clipping Losses & Module Degradation
Linda Thoren replied to ASZulu's topic in Simulations
Hello, With lower PV production due to ageing modules, it seems reasonable to see less overload losses. -
Multi-Year Analysis of Inverter Clipping Losses & Module Degradation
dtarin replied to ASZulu's topic in Simulations
It is expected for plant/inverter clipping to decrease as system capacity degrades. -
Multi-Year Analysis of Inverter Clipping Losses & Module Degradation
ASZulu replied to ASZulu's topic in Simulations
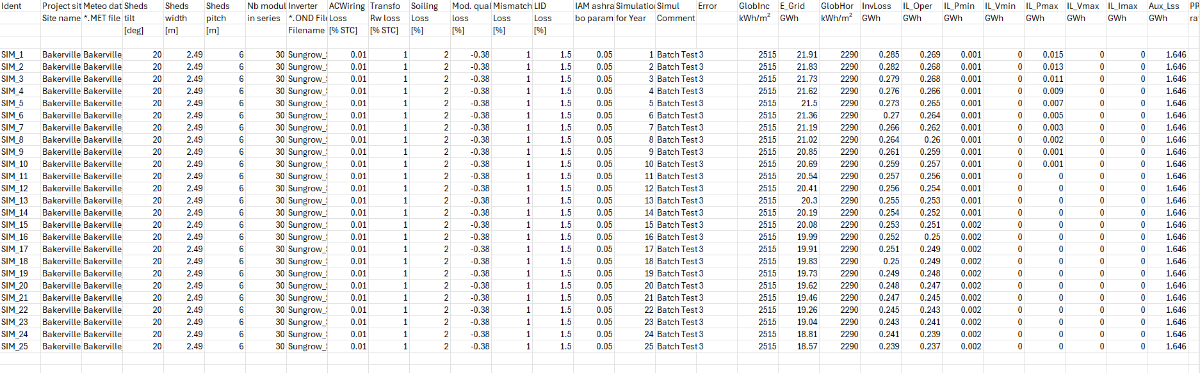
Hi Linda, Thank you. After ensuring that the "Simulation for Year" is from 1 to 25, I get results as per the below attachment. This now shows reduction in production, but somehow inverter losses (columns starting with "IL_") also decrease with each year, which is not what we had expected. Could I have missed something? Many thanks!
-
Multi-Year Analysis of Inverter Clipping Losses & Module Degradation
Linda Thoren replied to ASZulu's topic in Simulations
You define the year in the batch parameter csv file. As in the video tutorial un minute 7. Now indeed it seems like you are not varying any of the parameters and simulate the same project 25 times. -
Multi-Year Analysis of Inverter Clipping Losses & Module Degradation
ASZulu replied to ASZulu's topic in Simulations
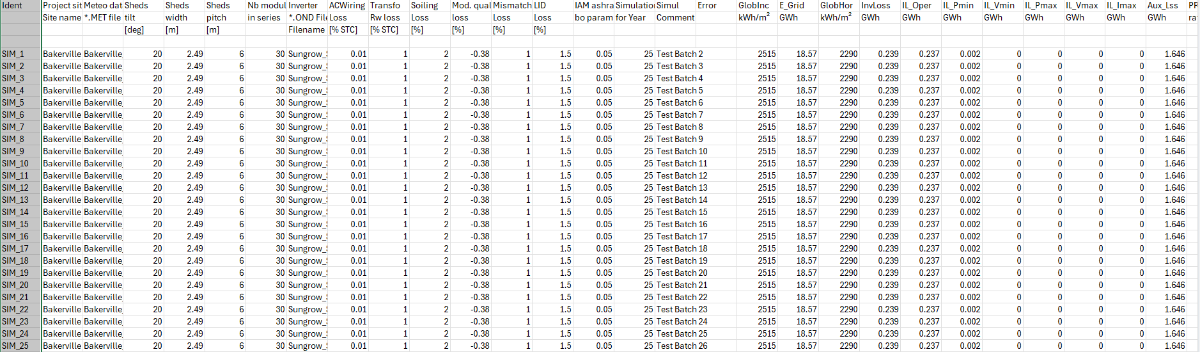
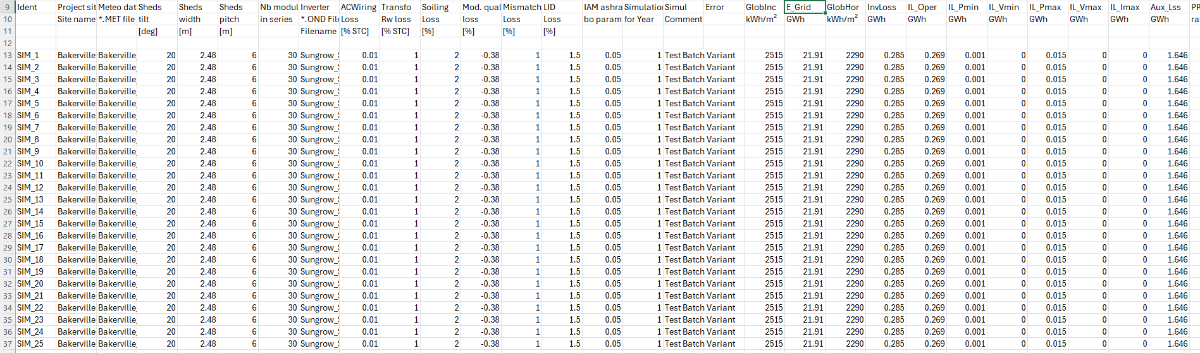
Hi Linda, Yes. Even when I change the Year No. to "25" in the "Aging" section within the "Detailed Losses", it seems to produce results related to that specific year as many times as there are rows. How do I ensure that each row is for each year, and not one year repeated across multiple rows (as attached)? Your assistance is really appreciated.
-
Multi-Year Analysis of Inverter Clipping Losses & Module Degradation
Linda Thoren replied to ASZulu's topic in Simulations
Hi, It seams like you have set all the simulations for year 1. In the 15th column "Simulation Year" -
Multi-Year Analysis of Inverter Clipping Losses & Module Degradation
ASZulu replied to ASZulu's topic in Simulations
Hi, Linda. When following the steps in the second video, I cannot seem to find the approach to simulating data for 25 separate, consecutive years. My resulting batch CSV shows the exact same outputs for all inputs, as per the attachment below: Please may you advise on where I went wrong or how I can edit inputs to show independent losses and resulting parameters to show the inverter behaviour over a 25-year period. Thanks again.
-
Multi-Year Analysis of Inverter Clipping Losses & Module Degradation
ASZulu replied to ASZulu's topic in Simulations
Thank you for this feedback, Linda. -
Multi-Year Analysis of Inverter Clipping Losses & Module Degradation
Linda Thoren replied to ASZulu's topic in Simulations
Hi, You find information of how to define the ageing in the following tutorial: The Batch mode is described in the following tutorial: -
Hello, When using the independent MPPT inputs feature, it is very important to have a multiple between the number of strings and MPPTs in each sub-array, or PVsyst can not equally distribute the strings over the MPPTs and you risk incorrect evaluation of the inverter losses over nominal inverter power. The MPPT and Power sharing feature is fully described in the following youtube tutorial: