All Activity
- Past hour
-
 Export the data (values) from the graphs and you will get short circuit values for V and I.
 - Today
-
 Markmax6 joined the community
 -
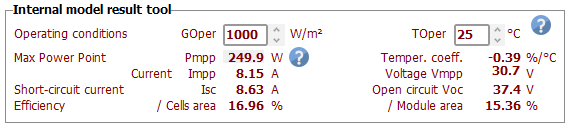
The PV module efficiency is the power generated by the PV module, divided by the power reaching the module in form of light. The generated power is calculated with the single diode model for the given external conditions (irradiance and temperature), while power in form of light is just the irradiance times the surface of the PV module.
-
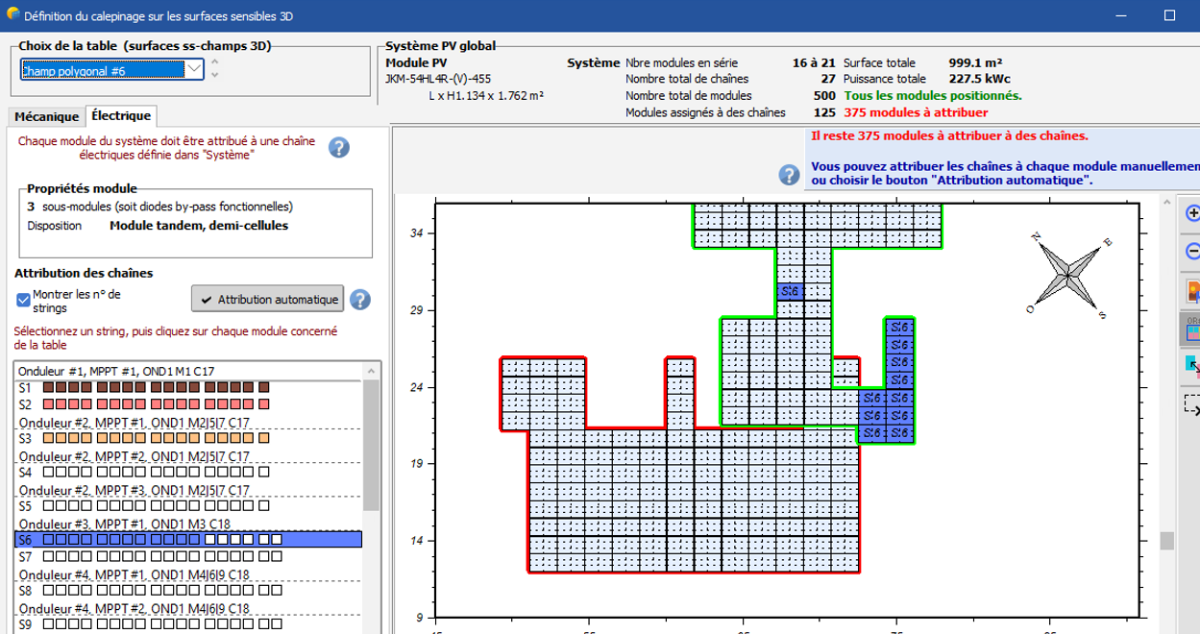
I don't see what you mean by "some modules are overlapping". For filling your field, you can do that manually by the mouse. But you can possibly use the option "Attribution automatique" (you have many options for doing this), and than correct what seems not suited for you, by exchanging/dragging the string attributions with the mouse.
-
 PVsyst doesn't provide a plot for this variation, because the Voc is not of big interest for the simulation. You can get the results of the model for any Irradiance and temperature conditions, in the PV module definition dialog, main page, "Internal model result tool":
-
 Hello, Indeed, this is not the expected behavior. Since the grid limitation is applied at the Pnom, we have observed that in certain situations—when the MPPTs operate under very different conditions—this may lead to results that do not perform as intended. To analyze your project in more detail, could you please export it as a .zip file and send it to our support team at support@pvsyst.com? We apologize for the inconvenience.
 - Yesterday
-
 nabdulgalil joined the community
 -
The answers to your questions are fully explained in the help: https://www.pvsyst.com/help/project-design/array-and-system-losses/ageing-pv-modules-degradation/index.html?h=ageing https://www.pvsyst.com/help/project-design/array-and-system-losses/ageing-pv-modules-degradation/module-performance-degradation.html 1. - ISC dispersion has nothing to do with the datasheets information. Its nature is explained in the help. 2. - You can evaluate the effect of the Current and Voltage degradation weighting by yourself, by excuting several simulations. You will see that this is not very significant. 3. - When you have one only module, it is quite obvious that you don't have any mismatch loss. 4. - In the ageing process, the mismatch between "degraded" modules increases along the time. 5. - This is an input parameter. The global degradation is the sum of the individual PV modules degradation and the increasing mismatch.
-
Hello, when I’m doing the electrical layout, I notice that some modules are overlapping. Screenshot below. Could you tell me if there is a solution, because I can’t create a module string for the upper PV field.
-
Hello Michele, thanks for your answer. Could you specify which calculation method you use for step 5) ? I found several methods but not sure which one is correct. Can I calculate it out of hourly output values? Thanks for your help!
-
 JaSc joined the community
 -
Bonjour, PVsyst ne permet pas la création de chaine de modules avec des orientations différentes, optimiseurs ou non. Si les deux orientations sont suffisamment proches, vous pouvez utiliser l'option d'orientation moyenne dans la scène 3D. La valeur de l'orientation utilisée pour la transposition sera celle de l'orientation moyenne, mais les ombres seront calculées sur la base de l'orienation réellement définie dans la scène 3D.
-
Dear Nicolas and Laura, Thank you for your post. We appreciate your feedback and your suggestions for improving PVsyst. Accessibility — including considerations for colour blindness and support for visually impaired users — is an important topic we are actively discussing, and we hope to bring improvements in this area in future versions of PVsyst. Regards, Eric
-
 I want to check how the Voc of a module changes at different temperatures and irradiance levels. How can I verify this? Although I tried the graphs section and the PV curve, I believe it is showing Vmp values instead. Please suggest how I can check the Voc of a solar PV module under these conditions.
 -
Bonjour, Je voudrais savoir comment définir un système PV avec des Optimiseur. le champs global comporte 2 orientations différentes donc nécessites des optimiseur, mais impossible de définir le nombre de panneau avec une orientation différentes. il y a une différence entre le système et la 3D.
-
 dlartin joined the community
 -
Dear Zahra, If you know the exact global wiring resistance of your system and want a precise result, you can fill in the field "Global wiring resistance". Usually, the value for "Loss fraction at STC" is used when the exact global wiring resistance is unknown and you are just estimating it based on the STC value. For module losses: LID losses: Not applicable for PV modules based on n-dop wafers. You need to know the technology used in your PV module. Otherwise, we don’t have precise information regarding LID losses, since manufacturers don’t usually share this type of data. You can decide to add 1% or 2% depending on your confidence in the PV module. See our help page: https://www.pvsyst.com/help/project-design/array-and-system-losses/lid-loss.html Module Quality: Please read our help page: https://www.pvsyst.com/help/project-design/array-and-system-losses/module-quality-losses.html Module Mismatch Losses: Please also see our help page: https://www.pvsyst.com/help/project-design/array-and-system-losses/array-mismatch-losses/index.html Usually, this is also an approximation, based on your assessment of the PV module quality and the variability between them. Regards,
- Last week
-
 Letan591 joined the community
 -
 zakari91 joined the community
 -

Electrical Mismatch Losses
AlexBackCwbBrazil replied to AlexBackCwbBrazil's topic in Shadings and tracking
Thanks! -
 kaurreitye joined the community
 -
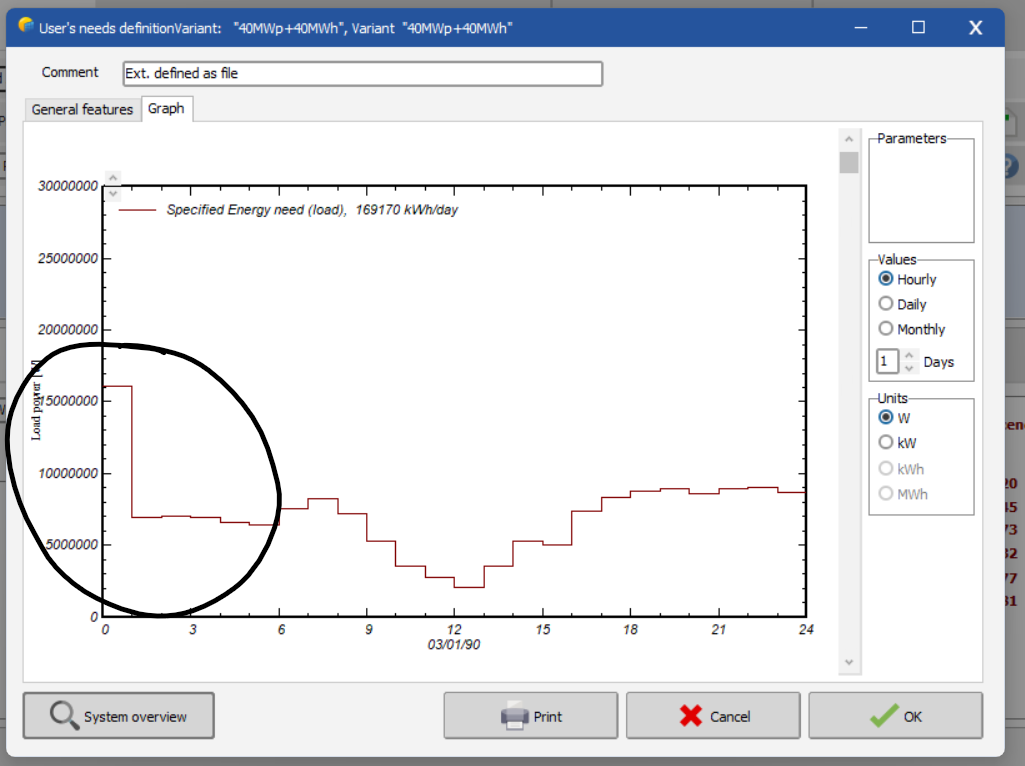
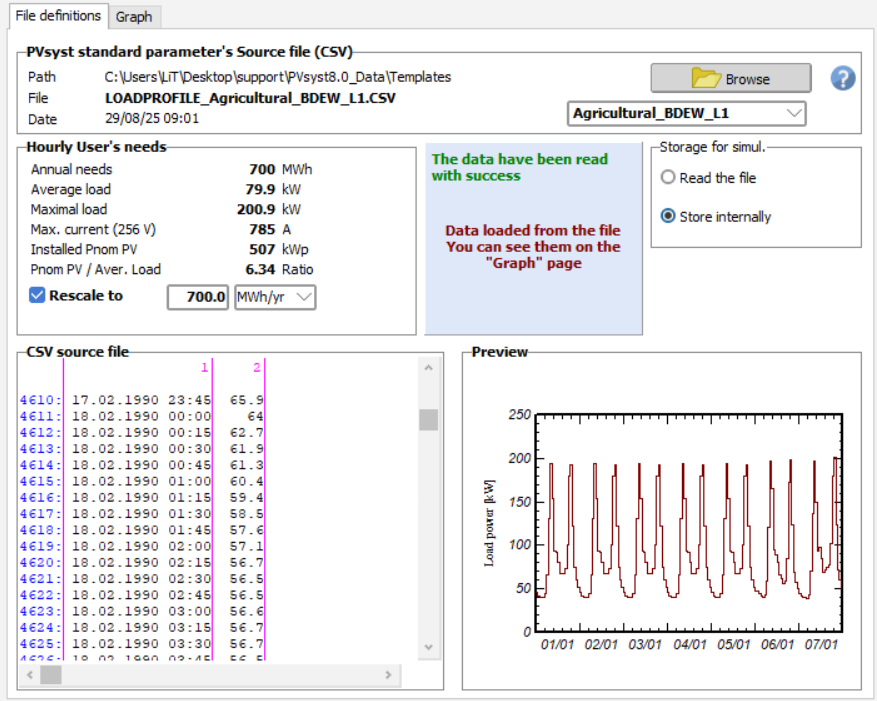
Sudden Load Profile Spikes After Importing File
Linda Thoren replied to Ady's topic in Problems / Bugs
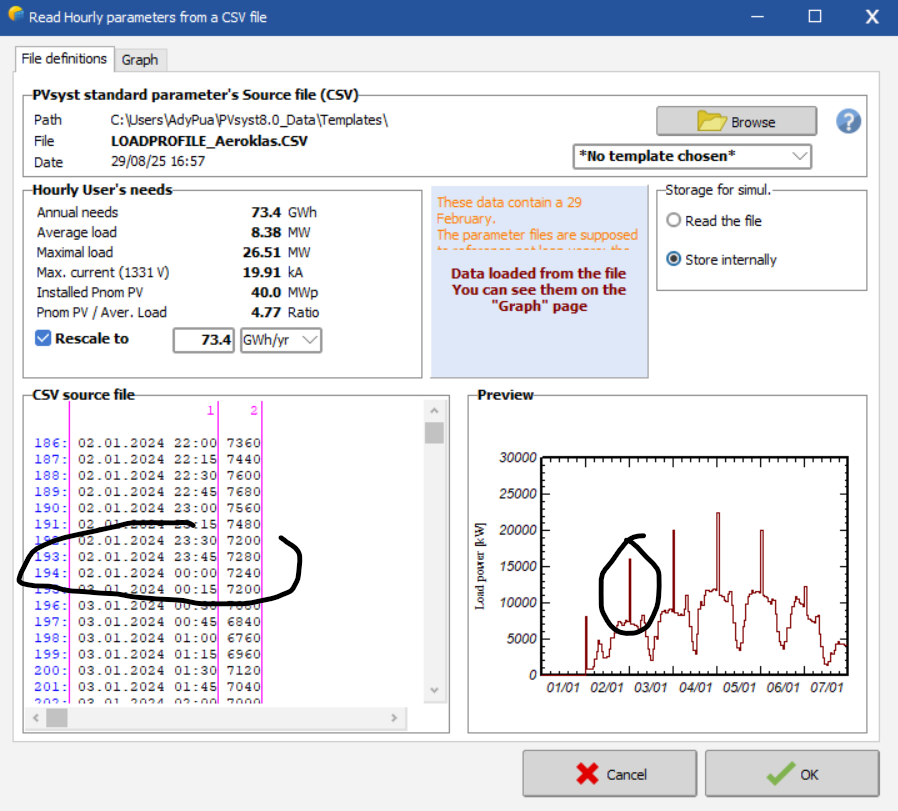
I notice that you have a warning message indicating that your file contains data for the 29th of February. Are you using weather data for this specific year (a leap year) or a generic year ? Try to take out the 29th of February from the dataset.
-
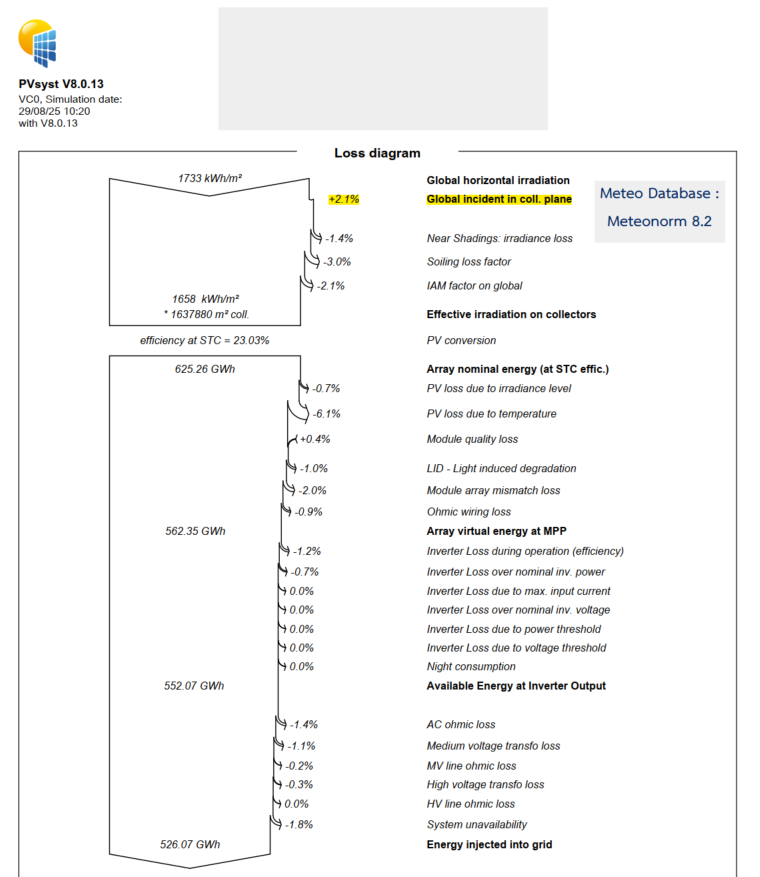
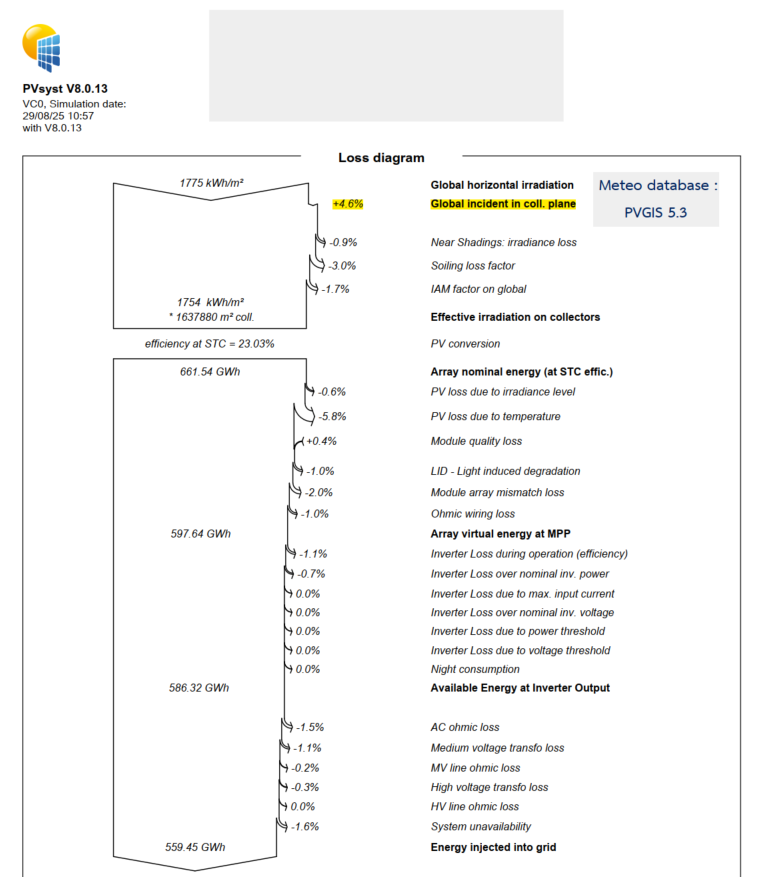
Hello, The differences in the databases will be in the global horizontal irradiance, and thus only indirectly on the global incident in collector plane. To calculate the Global incident in the collector plane, the same transposition method can be used for any source of weather data. The difference in direct and diffuse irradiance for instance can have a large impact in the incident in the collector plane. You can read mora about the transposition model in the following help page: https://www.pvsyst.com/help/physical-models-used/irradiation-models/transposition-model.html Indeed, there can be large differences in the weather data and it is difficult to evaluate which one is the most accurate at a specific site. We have done some comparisons that you find in the following help page: https://www.pvsyst.com/help/meteo-database/import-meteo-data/data-source-comparison.html?h=weather+data
-
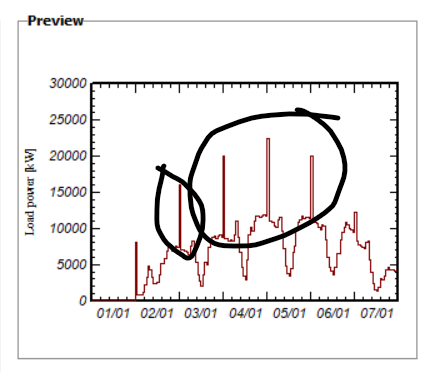
pls see below screen shot, the spike seem like happen at the graph...
-
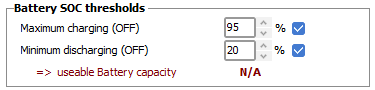
Sorry, I really don't understand your strategy. It is not the battery (or the Ecoflow) which decides when it starts charging or discharging, but the external conditions (user's needs or PV availability). Starting discharging at a given SOC doesn't make sense without a clear definition of the energy demand. PVsyst controls the the charging or discharging "autorizations" as a function of the SOC evolution. If you are discharging (drawing energy), the battery will stop delivering power when the SOC reaches the specified threshold "Minimum discharging". When you are charging, PVsyst will disconnect the PV production when the SOC attains the specified "Maximum charging". This may arise within hours, You have a part of the hour in one state, and another part in the other state.
-
 Hello, I have a question regarding the global incident in the collector plane loss diagram, where I noticed approximately a 2% difference between Meteonorm and PVGIS (due to the different meteorological databases). The same assumptions were applied in this project. Could you please clarify the possible causes of this difference? Additionally, I would appreciate your recommendation on which meteorological database is most commonly used in practice. Thank you for your support.
-
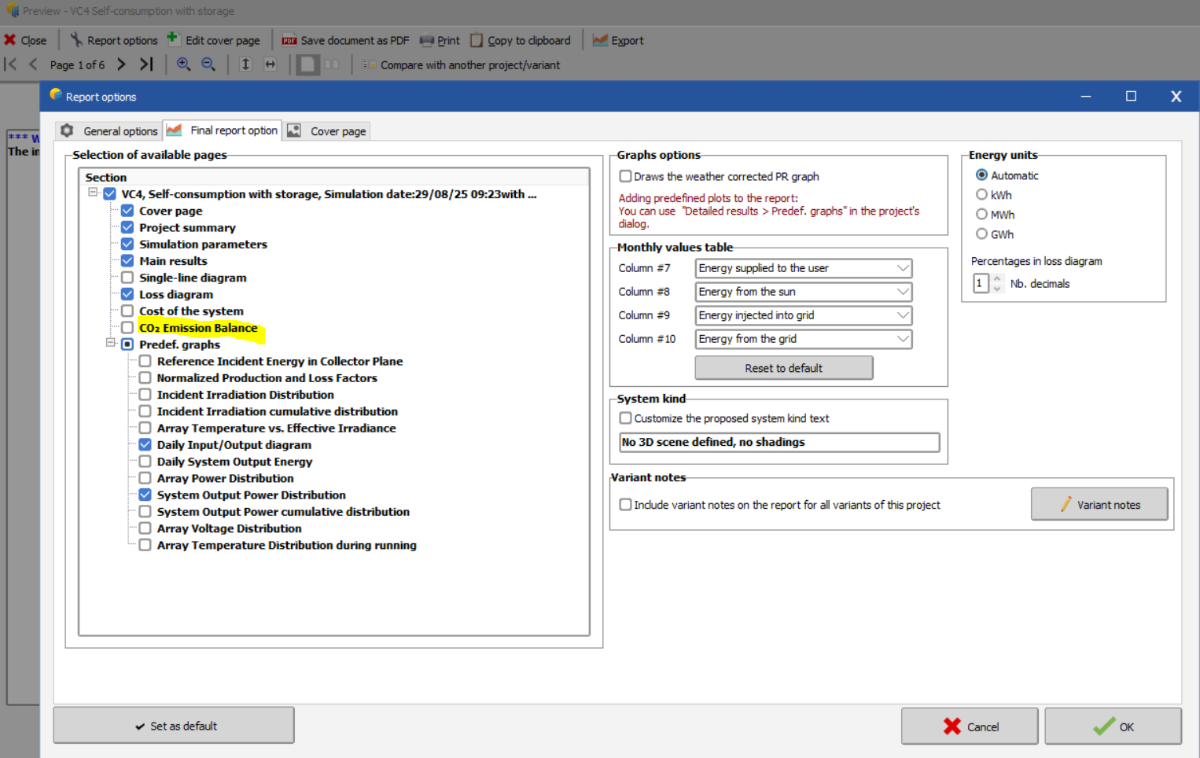
You find the carbon balance tool in the end of the economic evaluation window and you can choose to print the results in the report. In the report option, make sure the Co2 Emission Balance is enabled for the results to appear in the report.
-
Pakamas Teerasuwannajak joined the community
-
Sudden Load Profile Spikes After Importing File
Linda Thoren replied to Ady's topic in Problems / Bugs
Hello, Does the peaks only appears in the preview graphics or is there in issue with the actual values in the input? Does the Annual need and the CSV source file to the left of the graphic correspond to the original file? You can possibly try to run a simulation and export the results to verify that the simulation is made with the correct values
-
Where can I find out the carbon emission reduction value after modelling?
-
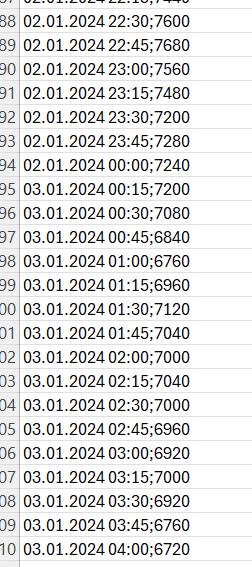
Hello, I defined a custom load profile as per the PVsyst template and imported it into PVsyst. However, after importing, I noticed some unexpected sudden spikes in the preview graph (screenshot attached, seem happen at 00 hour). The spikes do not exist in my original input file. They only appear after the file is loaded into PVsyst The rest of the profile seems to follow the expected trend. Could you kindly advise what might be causing this? Is it related to file formatting, delimiter issues, or data resolution mismatches? Are there any best practices to avoid such spikes during import? Any guidance would be greatly appreciated.
-
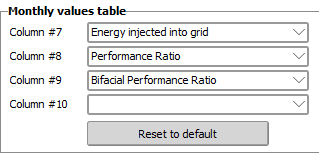
Hi, I noticed that the defaults for the variables shown in the monthly values table of PVsyst reports are now (v 8.0.15) as shown below. I would like to change these to our team's standard variables, but there's no option to show fewer variables. That is, a blank entry doesn't appear in the drop downs. Could we add that back? Thanks, Laura
-
Or one could use the standard "colorblind" color tables. Microsoft has implemented this in the Excel color defaults.