All Activity
- Past hour
-
 The structure shading factor is design to reflect the area covered by the structures. The electrical effect of this shading should be reflected in the mismatch loss factor. Thus if I understand your example correctly, the mismatch loss factor should be set to 40% if 40% of a cell in the concerned sting is shaded. For the structure shading factor, define only the ratio of the area covered by structures to the photovoltaic area.
 - Today
-
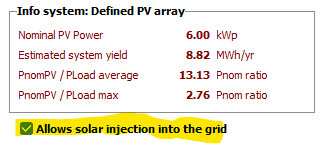
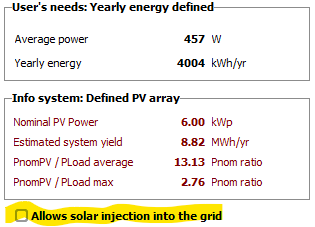
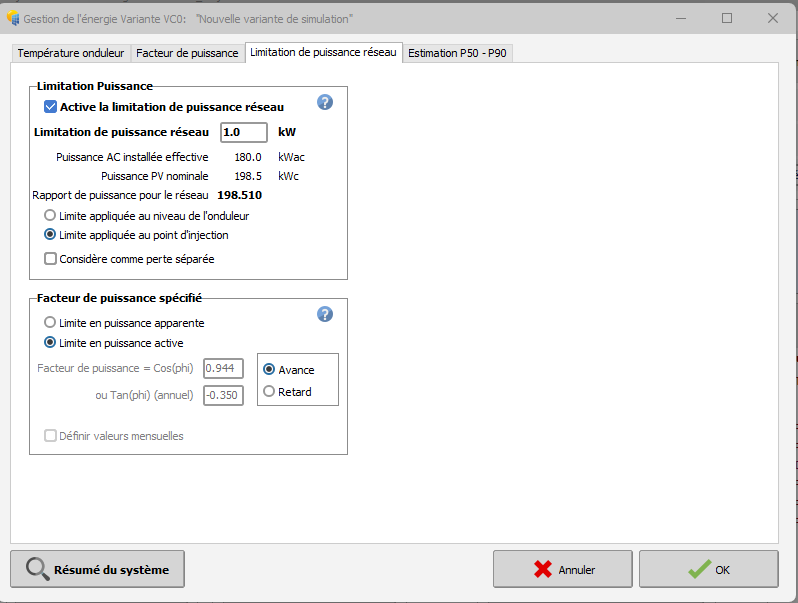
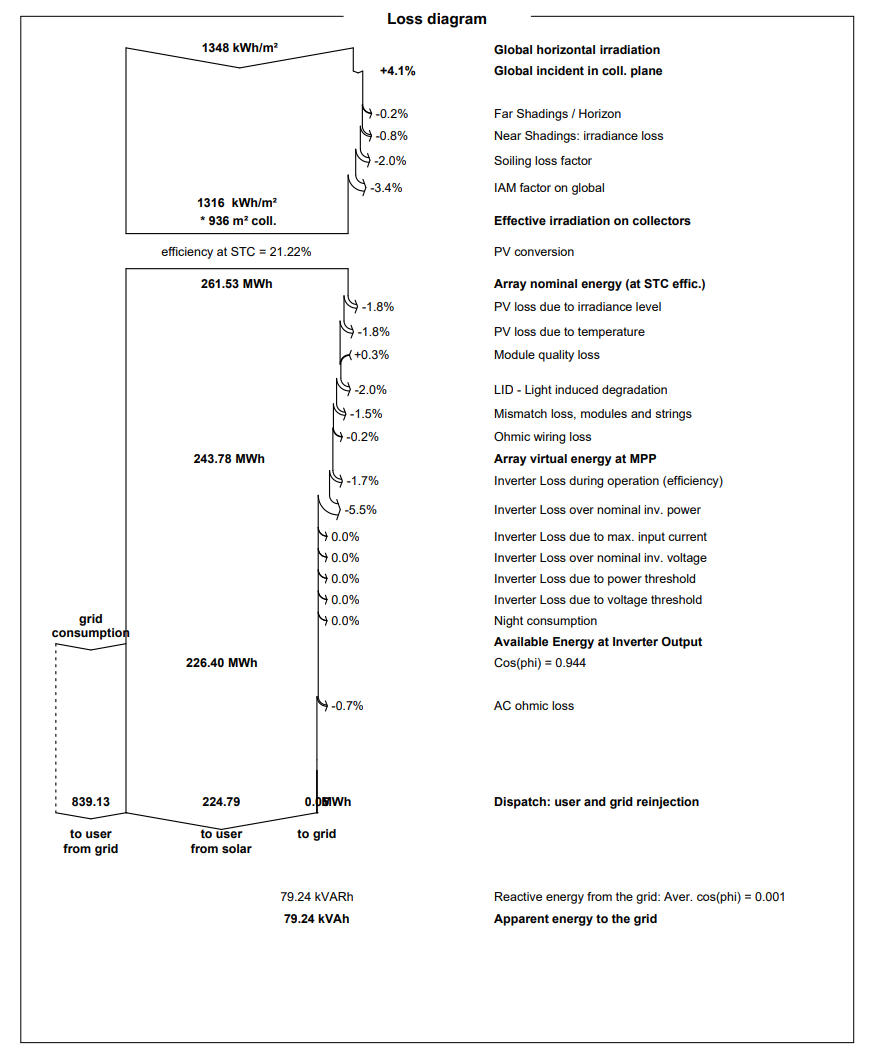
This is quite normal as you have defined a grid limitation of 1 kW (for a system of 200 kWp, 180 kWac). You can notice that the apparent value is 79 kVah, to be compared to a global delivery to the user of 224 MWh, i.e. 0.04%. Please note that you have the opportunity of completely forbid the injection to the grid when you define the self-consumption:

-
Understood - thanks for your response!
-
Dear Ben Arial Unicode Bold and Arial Unicode Normal font seem to be missing from your computer. Could you please check that you have it installed in your C:Windows>Fonts folder (Normal and Bold should appear for Arial Unicode MS) : If not you can install it from here: https://freefontsdownload.net/free-arial-unicode-ms-font-36926.htm If the problem remains, please export and send your log files to support@pvsyst.com by using menu "File>Export logs" Kind regards,
- Yesterday
-
Following a recent update, I'm no longer able to produce a complete report in PVsyst. As you can see in the attachment, the pages are missing most information. Please let me know what I should do to restore the report functionality.
-
 Hi Linda, Thank you for your reply! Can you also please clarify what your estimate is for structure shading factor based on my post (10% or 40%)? And isn't your comment on mismatch effect related instead to structure shading factor. i.e. where you wrote, "as the current in a string is the current in the worst cell, if the structure covers x% of one cell, the shading effect will be x% for the concerned string. For example, the loss may be reduced by a factor of 2 if the structure covers half a cell (or two half cells)." Thanks again, Ben
 -
I would like to model a PV system with dynamic clamping (i.e. no electricity reinjected into the grid). The building’s consumption data has been uploaded in the “self-consumption” section. In the “energy management” sections, the grid limitation has been set to 1 kW with the option “limit at the injection point” (since setting the limit to 0 kW did not trigger any clamping). In the loss diagram, the active energy injected into the grid is correctly shown as 0 MWh. However, the apparent energy injected is not equal to zero. How can this be explained? Thank you in advance.
-
 TGR joined the community
 -

Battery being under-utilized in self-consumption simulation
André Mermoud replied to Dean O's topic in Problems / Bugs
Yes indeed, the battery model of PVsyst uses information which is not always present on the datasheets. Some datasheets are really very brief. When you have to define a battery by yourself, you are advised to start from an existing battery, and adjust the relevant variables (mainly technology, kind of battery, number of cells in series and parallel, internal resistance (check dafault), self-discharge (check default), lifetime (numbe of cycles), sizes and weight -
 paterrrrr joined the community
 -

Report shows spectral correction applied even when it isn't
Chen replied to LauraH's topic in Problems / Bugs
OK, thanks - Last week
-
 Beekay joined the community
 -
 Bulle Jarso joined the community
 -
Yes, you can create elementary shading objects in your scene, whether you imported the scene from a 3D file or created it yourself
-
Report shows spectral correction applied even when it isn't
Linda Thoren replied to LauraH's topic in Problems / Bugs
it is the coefficient set for that specific PV module technology. You can find additional information in the following help: https://www.pvsyst.com/help/physical-models-used/pv-module-standard-one-diode-model/firstsolar-spectral-correction.html#spectral-correction-in-pvsyst -

Battery being under-utilized in self-consumption simulation
Dean O replied to Dean O's topic in Problems / Bugs
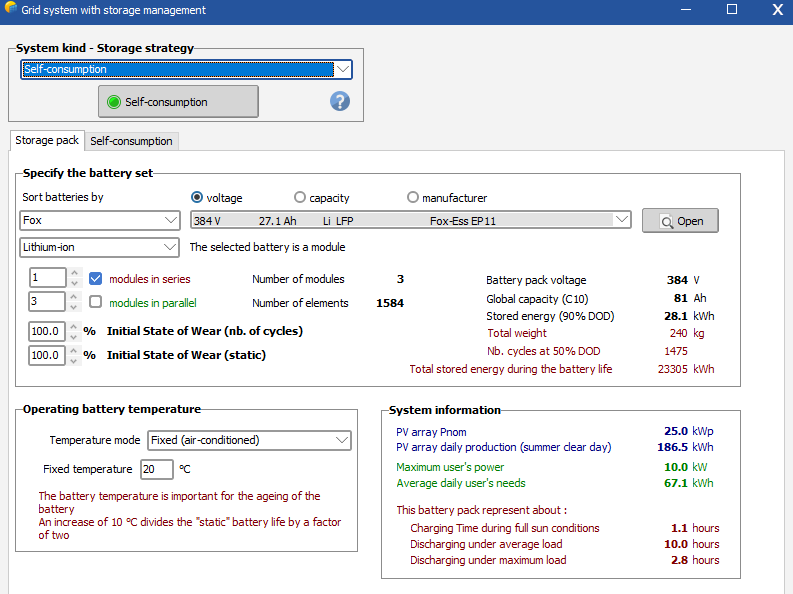
I figured out what the problem was. I hada manually created a battery with 11kWh of energy but somehow this was only being read as about 4kWh due to incorrect setup. Once I switched to another battery of a similar size in the existing database the battery utilization behaved as expected and I got up to 11.8MWh of self-consumption a year. I should add that setting up your own battery on PVsyst is deeply confusing as it requests detailed information about cell design that is not available on the manufacturers tech sheet. Even though it said the battery had 11kWh of available energy it did not. -
Battery being under-utilized in self-consumption simulation
Dean O posted a topic in Problems / Bugs
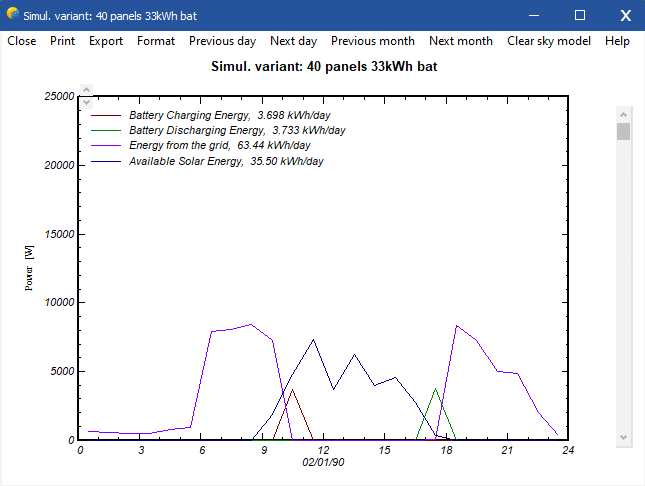
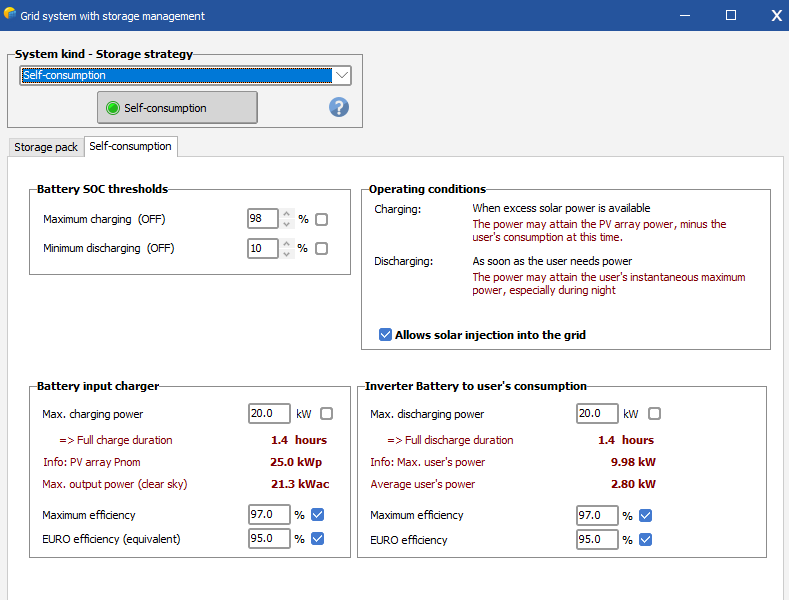
I'm trying to run a simulation where a customer has load only ealry in the morning and late in the evening. Normal PV would not be sufficient to cover this so we are using batteries to store the energy during the day, which will then discharge to cover the evening load. When I run the simulation with 20kW PV only it produces 25MWh / year and the self-consumption is 5MWh / year, which is understandable. When I add 33kWh of storage to the system however, it only increases the self-consumption by 1.5MWh / year, which seems very inaccurate. When I look at the houlry graphs I see that the battery charge and discharge is only 3-4kWh / day, which doesn't make sense considering the PV is 20kW, the battery is 33kWh and the customers evening load is in the 30kWh range, being a spike from 0-8kW for about 3 hours from 6-9, then dropping back to 0. With this profile I would expect the battery to fully charge during the day and then be able to discharge around 28kWh in teh evening (given a 90% DoD). Why is this not happening? When I look at the the battery state of charge hourly graph it shows that the battery is fully charging and discharging every day, which should mean this much power is being transfered, so why is it only showing 3-4kWh of energy and not 28? With a full charge / discharge cycle every day all year I should get around 9MWh of use out of the battery so why is it only giving an uptake of 1.5MWh? I've triple checked all the settings and the battery capacity is correcet, the max and min charge valume is correct and the customer load profile is as described. Please can someone help me with this issue as I nee to accurately predict these figures for many clients and I cannot get it to work. I have attached a typical load profile for a day with the system and the battery settings.
-
Dean O joined the community
-
Can this be applied when I am importing a DAE file?
-
Auxiliary Energy Losses – How is the calculation performed?
Linda Thoren replied to Maynara Torres's topic in Simulations
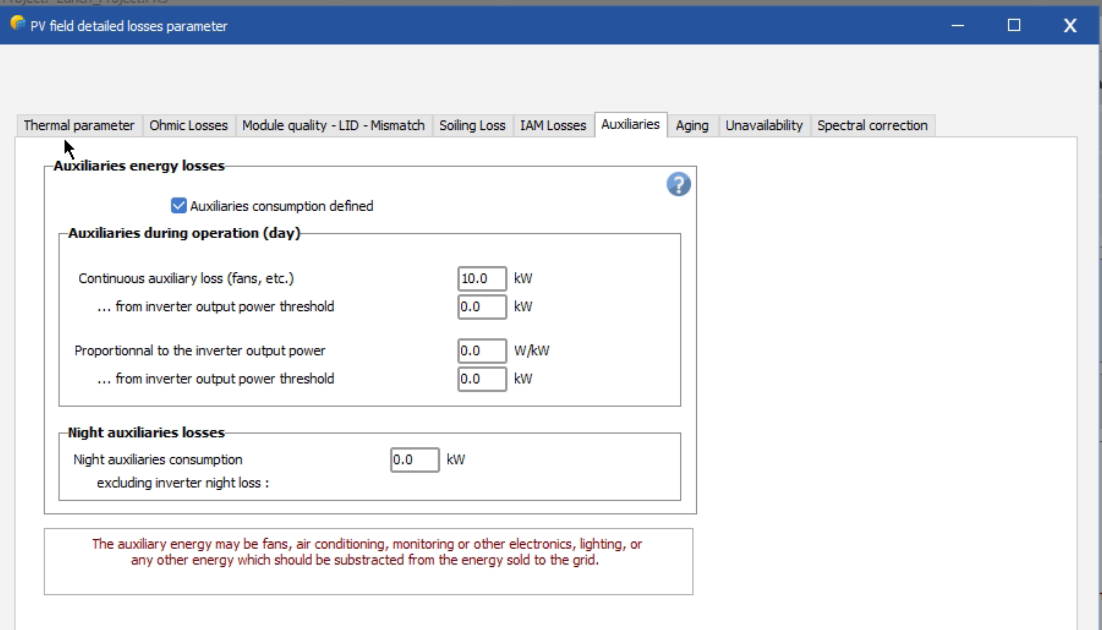
Hello, In the loss diagram, each loss is defined as percentage of the previous energy quantity. In general, if you have defined a continuous auxiliary loss and export an hourly output file, you will see that this value will remain constant, though the percentage it will represent will of course vary depending on the production (if you for instance look at the loss diagram for the different months). You can read more about the loss diagram and the auxiliary losses in the following help page: https://www.pvsyst.com/help/project-design/results/loss-diagram.html https://www.pvsyst.com/help/project-design/array-and-system-losses/auxiliaries-consumption.html Please let me know if this answers your question. Kind regards, -
Report shows spectral correction applied even when it isn't
Chen replied to LauraH's topic in Problems / Bugs
what does the C0 C1 C2..C5 mean? thanks! -
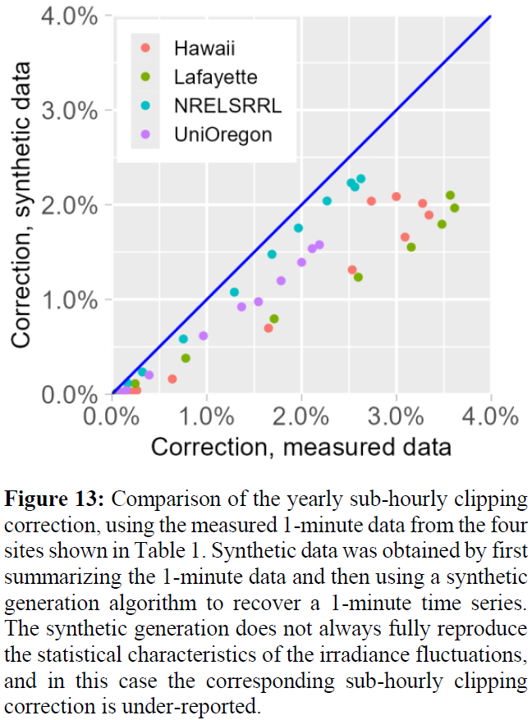
@Linda Thoren Scientific literature (e.g., Clean Power Research CPR, UL, Townsend, PVsyst, several others) indicates that synthetic 1-min. satellite data exhibit only ~60% of natural radiation's variability as compared to ground-based data, thus defeating the purpose of performing subhourly corrections. For example, below I include an excerpt from a PVsyst publication on this point [1]. Furthermore, it remains unclear how to then accurately use subhourly correction results derived from a 1-min. dataset, obtained via PVsyst V8, together with the ultimate hourly, typical meteorological year TMY dataset employed ubiquitously in the simulation used for project finance. Thank you. 4.3 Synthetic data The correction model relies on sub-hourly data, ideally 1-minute data, or at least a sampling frequency that matches the variations in power of the DC array. Arguably the most reliable source for high frequency data are ground measurements. However, in practice, it can be difficult to obtain this data, especially during preliminary design phases for the PV system. One possibility is to rely on a synthetic generation procedure. This type of approach allows to generate sub-hourly fluctuations from a lower sampling frequency input. For example, one can use typical statistics for sub-hourly data to complement satellite data, which is found generally in 15-minute time steps. The result of this procedure is a high frequency time series that matches the original measurements up to a certain time scale (e.g. 15 minutes for satellite data). We refer the reader to [8], e.g., for a more thorough discussion on this subject. Since the clipping correction can utilize any sub-hourly time series, as a proof of concept, we use here the hourly averages for the data obtained from Table 1 and utilize such a synthetic procedure to generate a 1-minute time series. The results are summarized in Figure 13, compared against those from Figure 11, where the original time series was used. From these preliminary results we can extrapolate that the synthetic generation methodologies may induce further biases. Indeed, in the example we have studied, the clipping correction extracted from the synthetic data is lower for all four sites and for all DC:AC ratios. <see attached image> Figure 13: Comparison of the yearly sub-hourly clipping correction, using the measured 1-minute data from the four sites shown in Table 1. Synthetic data was obtained by first summarizing the 1-minute data and then using a synthetic generation algorithm to recover a 1-minute time series. The synthetic generation does not always fully reproduce the statistical characteristics of the irradiance fluctuations, and in this case the corresponding sub-hourly clipping correction is under-reported. [1] M. Oliosi, B. Wittmer, A. Mermoud, A. Bridel-Bertomeu, and R. Vincent, “Implementation of a Sub-Hourly Clipping Correction in PVsyst.” WIP-Munich, 2024. doi: 10.4229/EUPVSEC2024/4DV.4.7.
-
 How is the calculation of auxiliary losses defined in the Detailed Losses section performed? I entered the plant load power value, and the system returns the percentage value of auxiliary losses based on the value I provided. But how exactly is this percentage calculated? What is the relationship between the load power, the total plant power, and the resulting kWh value?
-
Maynara Torres joined the community
-
 Omid joined the community
 -
Hello, When defining monthly values, it is assumed that the consumption that month is identical throughout the month. Thus from kWh/month to an average power is simply a calculation of how many hours there are per month. Note that the average power need for monthly values are reflecting day and night consumption, thus it does not directly make a very good basis for the needed installed AC capacity, but at least a fist order of magnitude.
-
I have encoded a list of monthly values (kWh/month) in the Self-consumption parameters. It resulted in an average power in kW. I would like to ask how the software computes this value. Also, can this average power (kW) be a basis for the kWac of the system that I will be designing?
-
 Mustapha Bennour joined the community
 -
 Elzed40 joined the community
 -
about PV module ageing parameters : Imp/Vmp contributions
André Mermoud replied to Chen's topic in Problems / Bugs
You can find some data about the current and voltage degradation in the works, namely, of the TISO in Switzerland. For example in this publication: https://www.researchgate.net/publication/256080133_TISO_10_kW_30_years_experience_with_a_PV_plant -
It is correct, that PVsyst uses the Erbs correlation for the case that only GlobHor (GHI) is given, and the diffuse contribution needs to be derived from a model. The report does not seem to reflect this properly. A ticket has been created to fix the problem in one of the next PVsyst releases. Thank you for reporting the issue.
-
We obviously don't avail of detailed ageing data for a specified PV module. The average degradation rate itself is really not well defined. In the literature you can find a wide panel of values (0.3% to 1%/year). The PVsyst proposition of 0.4% seems a reasonable choice for usual modules. The specific mismatch effect due to ageing has been developed "theoretically" as a tool in PVsyst, without any experimental basis. We don't know any publication studying this problem in the literature. The hypotheses under this evaluation (Monte Carlo evaluation of the dispersion progress) are purely speculative. Therefore this model is obviously not able to take your particularity into account in a reliable way. You can probably take a lower value for the Isc/Vos RMS.
-
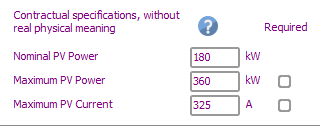
The PVsyst proposition doesn't take the maximum current into account. It is your job to check it in your final design. However the maximum current of a PV array is not well defined: the value corresponds to the STC (1000 W/m2), but if the inverter is specified for a given maximum current, it will limit the array current during operation, by displacing the operating point on the I/V curve. By the I don't see where you find that maximum current of 180 A. The manufacturer specifies 325 A in the PVsyst database: Your configuration of 15 strings of 25 modules of 650 Wp represents a PV power = 243 kW, i.e. a current of 238 A under 1020 V at STC.
-
Hi, There isn’t a dedicated “handrail” object for roof safety in Near Shadings. While Simple and Double crossbar railings exist as Elementary shading objects, the most reliable way to add a continuous 1 m guardrail around each zone is to model it with parallelepiped objects and place them along the zone edges. In your scene, go to Create → Elementary shading object and choose Parallelepiped. Set the dimensions, for example: Height: 1.00 m, Width (thickness): 0.10 m (or match your actual fence width), Length: as needed for each edge. Place the object along a zone edge, then copy and paste it to cover the entire perimeter. Rotate (using rotate tool in the Modify section) as needed to align with each side. If your project specifically uses a crossbar-style railing, you can also try the Simple or Double crossbar elementary objects instead of parallelepipeds.