All Activity
- Past hour
-

Sudden Load Profile Spikes After Importing File
André Mermoud replied to Ady's topic in Problems / Bugs
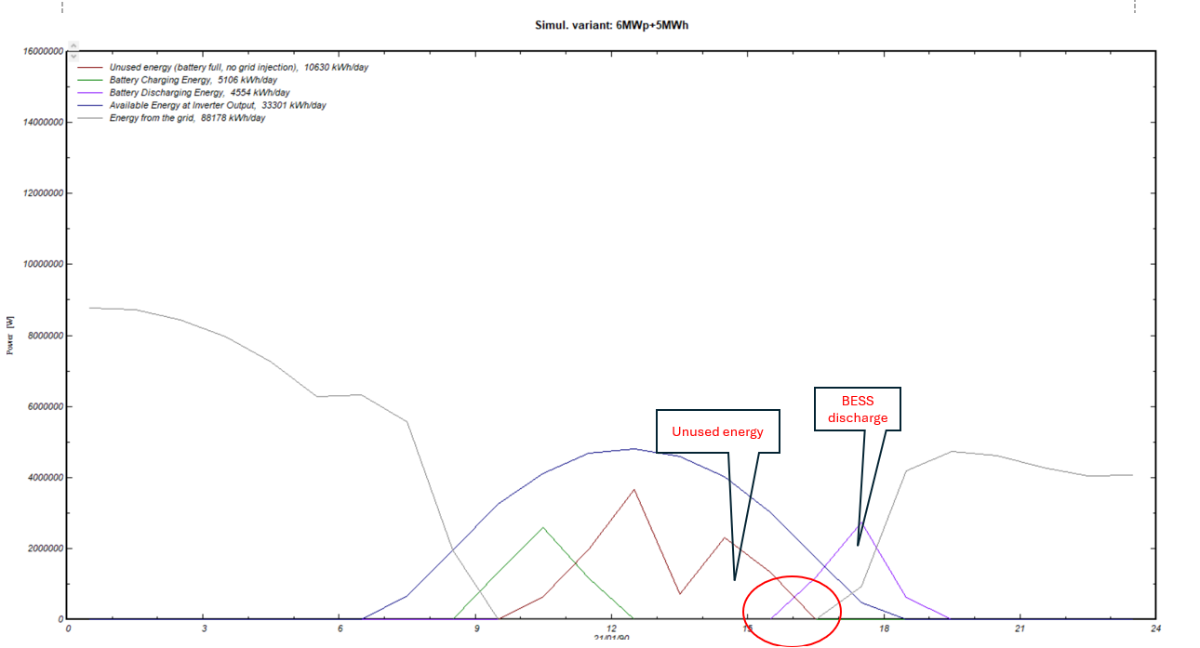
Please remember that we are working in hourly values. And the thresholds according to the battery SOC may arise during the hour, so that the transition from an operating state to another one may arise during the hour. Therefore you can have a "Battery full" state at the beginning of the hour, and a discharge during the rest of the hour. However there is also a visual artefact because you are showing lines from the middle of hour to the middle of the next hour. In your first plot, at 13:30 you have unused energy, but no BESS discharge. At 14:30, you have BESS discharge, but no Unused energy. The intermediate lines don't have any meaning. - Today
-
No sorry it is not possible to divide your system in the batch simulation.
-
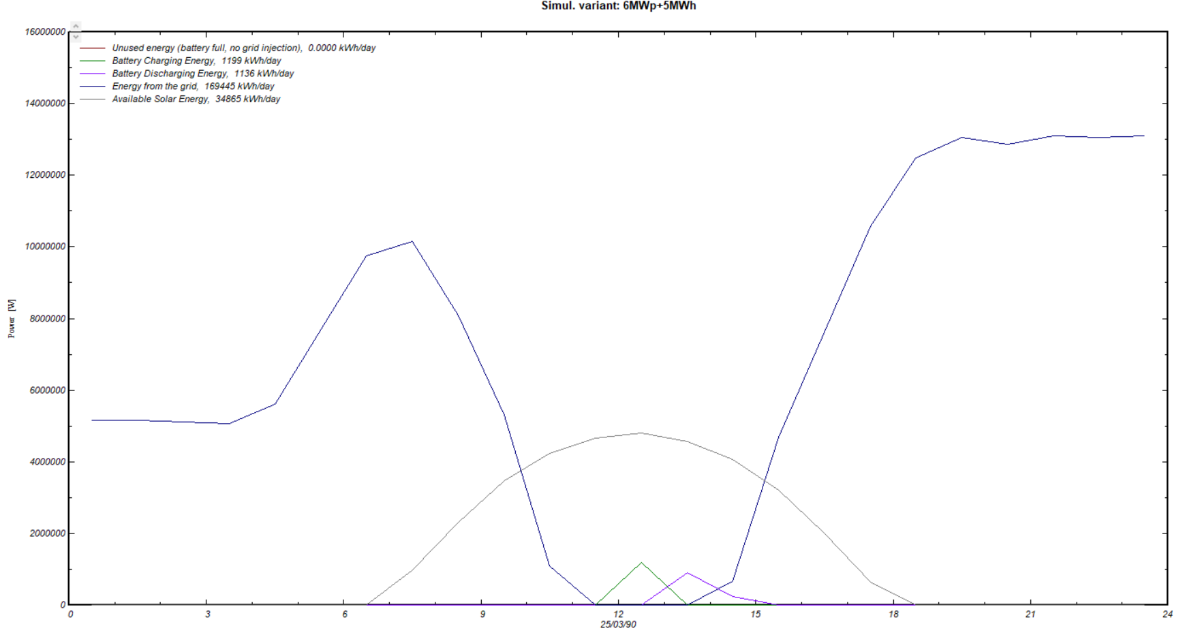
I’m seeing an unexpected overlap in the results for a project with ~6 MWp PV + 5 MWh BESS (see attached screenshot). Simulation setup: self-consumption with storage; grid injection disabled. Issue - 1st screenshot Around late afternoon (≈16:30–18:00 in the attached plot), the curves show “Unused energy (battery full, no grid injection)” and “Battery Discharging Energy” occurring in the same time window. My expectation is that if PV is being curtailed because the battery is full and export is not allowed, the battery should not discharge during that same period unless the load exceeds available PV and the battery can no longer charge. Issue - 2nd screenshot "Battery Charging" and "Battery Discharging" accure in the same time window. please clarify.

-
hi, able to solve the above issue.. thanks.
-
 Mathew Komabo joined the community
 - Yesterday
-
Hi everyone I would like to use the aging tool to model 35 years of generation based on Canadian Solar bifacial monocrystalline panel (CS6.2-66TB-H). Could you please recommend a value for "Av. degradation factor" for such panels? Does the default value for "Imp RMS dispersion" and "Vmp RMS dispersion" assume any panel replacement during the 35-year project lifetime? My company used string inverter monitoring and drone scan to spot defective panels and replace them. Heavily degraded panels might be moved to the same array and replace by new panels at some point in time. Over the project lifetime, we estimate that up to 25% of the initial panels will be replaced. This strategy shall mitigate mismatch losses to some extent. How can I take this into account in the "Imp RMS dispersion" and "Vmp RMS dispersion" values? Thank you Best regards Simon
-
 Simon 33 joined the community
 -
 Phurba joined the community
 -
 aaa joined the community
 - Last week
-
Can I use the batch simulation feature instead when I have many inverters? If so, how can I use this?
-
 Can PVsyst please comment on this post? I have the same question and want to add that there are a lot of sources that recommend calculating the structure shade factor simply by taking the ratio of the width of the racking (or torque tube) on the rear side by the length of the module (assuming it's in portrait orientation). My concern is that this is not taking into account the electrical effect of shading a row of cells that is in series with the rest of the cells, i.e. the current will be reduced in the entire module if you shade just a single row of cells. So the calculation should be the width of the row of cells divided by the width of the racking or torque tube, correct? This is in line with PVsyst's instructions, "the current in a string is the current in the worst cell, if this mechanics covers x% of one cell, the shading effect will be x% for the concerned string. This loss may be reduced by a factor of 2 if the mechanics is covering half a cell (i.e., the shade is distributed on 2 cells). " In summary, following these instructions, assuming the racking above shades 40% of the row of cells behind it, even if it's only 10% of the length of the module, would the Structure Shading Factor be 40%? Or 10%?
 -
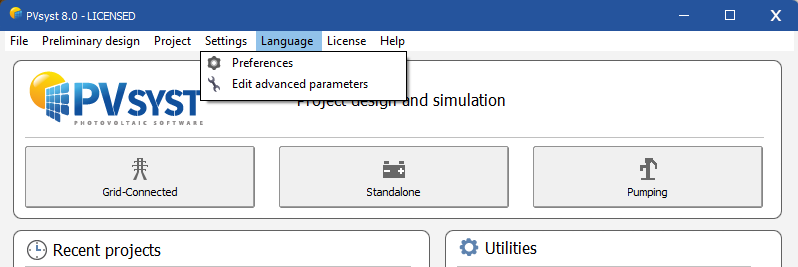
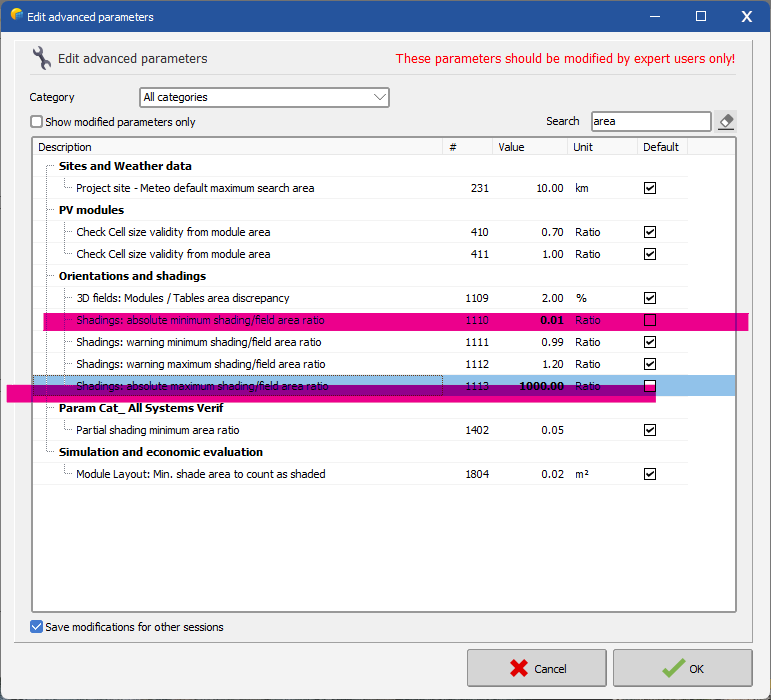
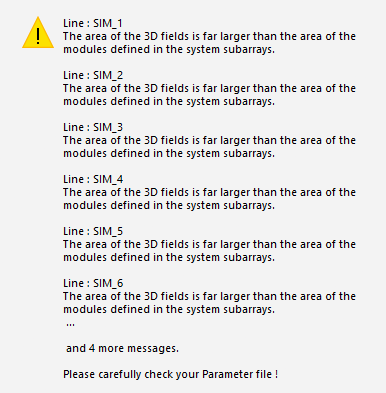
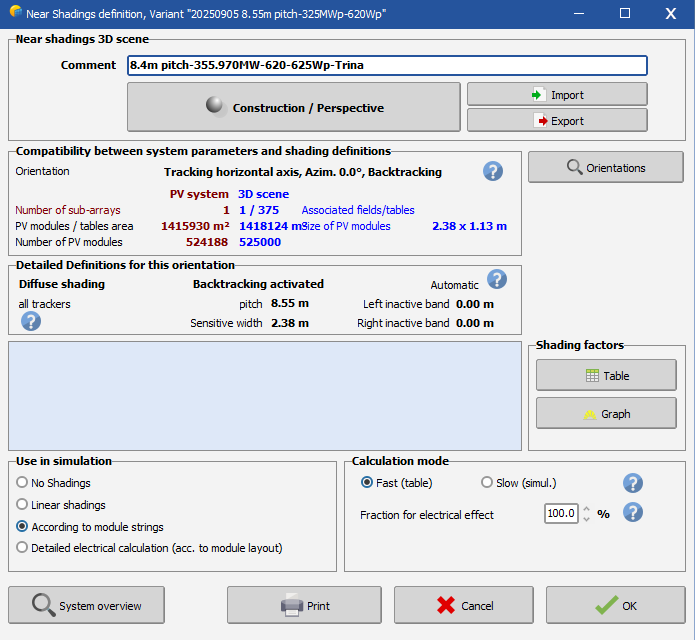
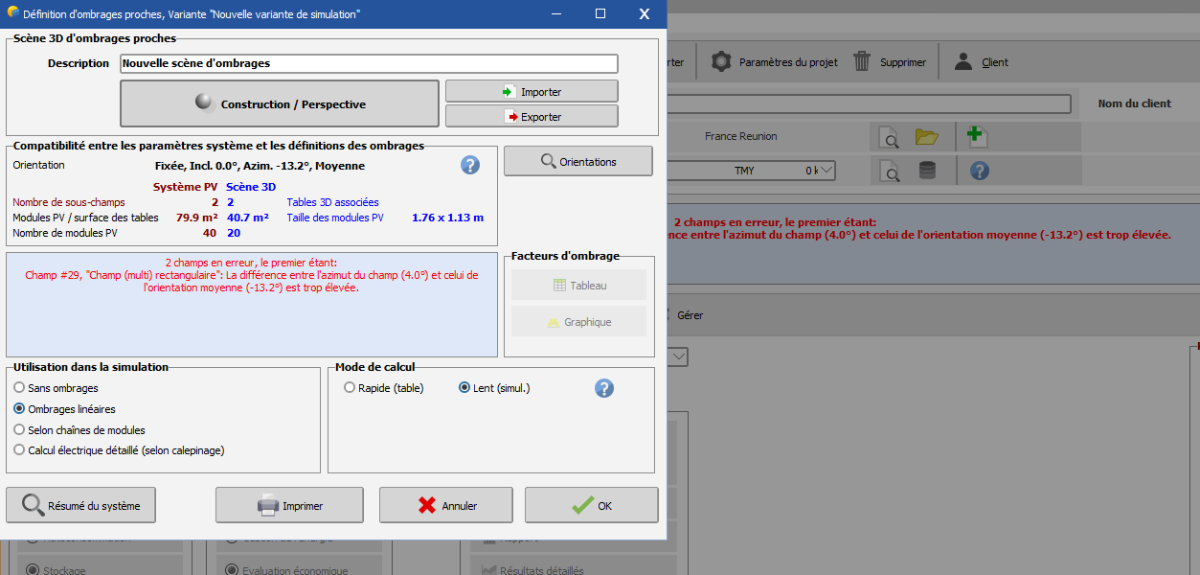
 Dear Johan, From your error message, we can see that the 3D scene is larger than the declared system. I noticed that you are changing the number of trackers in batch mode, while also modifying the number of strings in parallel. There is a workaround to make this work: In PVsyst, go to Settings → Edit advanced parameters. In the search box, type “area”, then adjust the parameter as highlighted below. Regards,
-
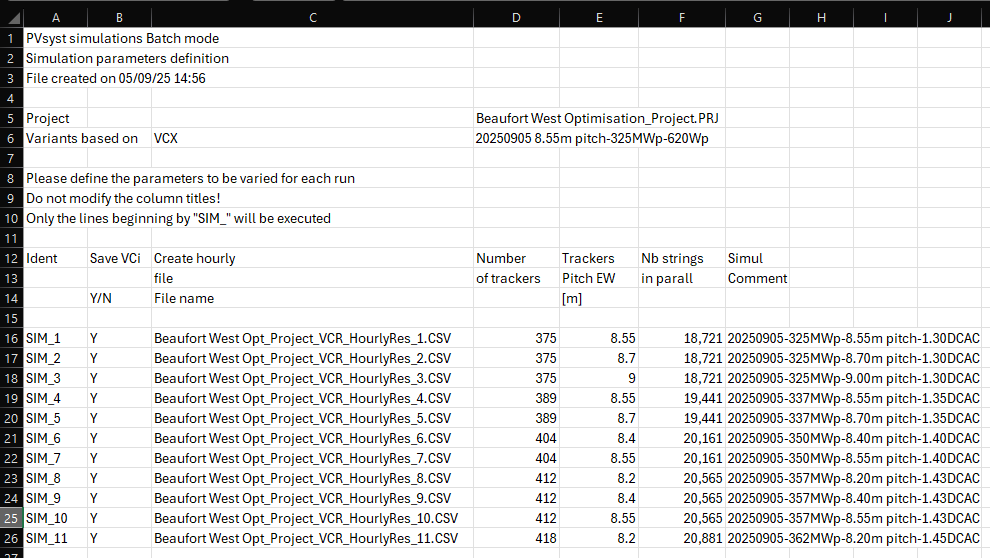
 I am getting the same error message when trying to run batch simulations. Any assistance would be appreciated. Images of error messages, Near Shadings screen and Batch file inputs included.
-
 Aniket4you joined the community
 -
Johan joined the community
-
Indeed, the final simulation result always corresponds to the full system. To view the results of the individual inverters, you would need to simulate each one in a separate variant. Depending on how AC losses are defined, the two individual inverters should produce approximately the same as when they are simulated together, although some post-inverter losses may differ due to the lower total system power. If your full system has two inverter before the injection point, this is how you should simulate the system, rather than adding variants together. Separating the inverters into separate variants is a work around to evaluate the individual inverter performance.
-
Just to follow up on this. Let's say my whole system has 2 inverters. If I want to know the output of each inverter individually, I need to do two variants, with each variant having the defined inverters of my system. Then, if I run that and extract the csv file, will the E_grid of the two variants add up to the E_grid of the variant for the whole system? With this, can I say that this is how I can proportionate the output of the inverters?
-
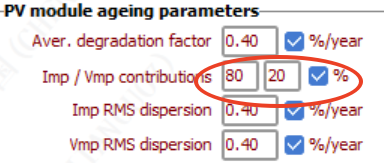
Dear PVsyst team: For the Imp/Vmp contributions 80/20%, is there any relevant literature to support the value of this parameter? Thank you!
-
Ben R joined the community
-
 baharak joined the community
 -
First of all, the inverter's behaviour with grid voltage deviations is very rarely described in the datasheets, and probably different for each inverter. By the way, PVsyst doesn't treat possible Grid voltage variations along the time. This is not part of the input variables, and we really don't see from which source we could evaluate it in prevision simulations.
-
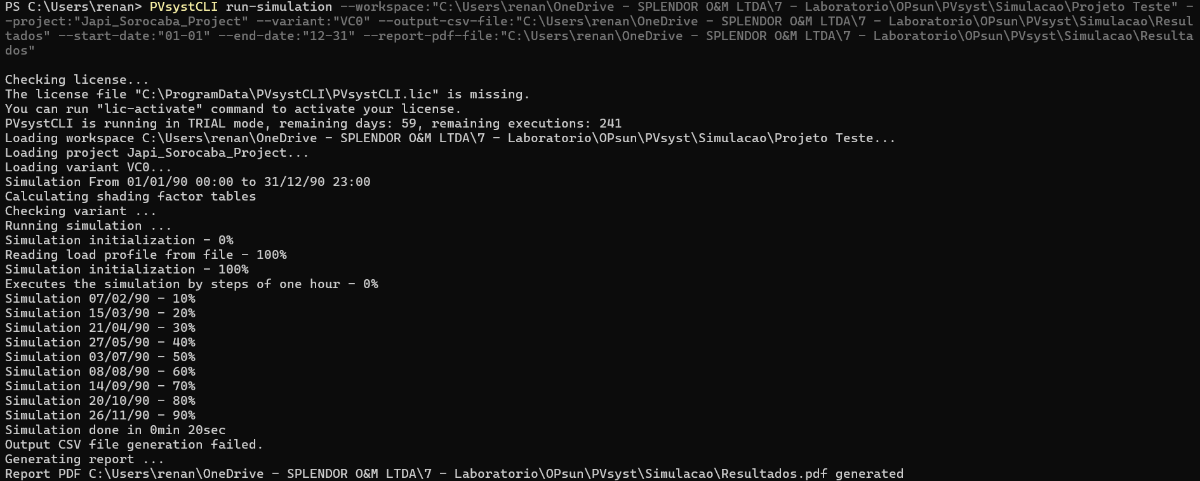
Dear Renan, Thank you for reaching out. For "--output-csv-file" and "--report-pdf-file" options, you need to specify the file name with extension, not only the folder: --output-csv-file:"C:\Users\renan\.........\Resultados\Results.csv" --report-pdf-file:"C:\Users\renan\.........\Resultados\Results.pdf" If the problem remains, please export your log files by using the command: PVsystCLI export-logs Once the logs zip file is generated, please send it to support@pvsyst.com Best regards.
-
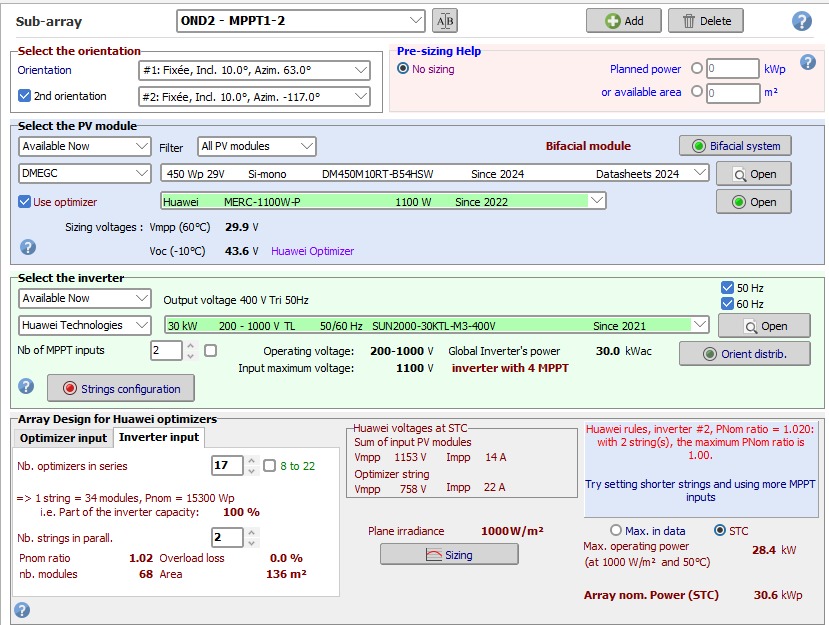
Compatibility rules between optimizers and inverters are implemented in PVsyst directly based on Huawei's requests. In this case, Huawei requested the maximum connected power to be limited to a certain DC/AC ratio. This is what is displayed in the message box: with only two MPPT input used, the maximum allowed DC/AC ratio is 1. Because you have a total connected STC power of 30.6kW, this configuration is not considered valid for Huawei. Huawei asked us to strictly enforce their rules, so there is no possibility to overstep this one. The only solution is to change your system somehow (configuring more strings, or slightly altering your inverter AC power or modules power so keep the DC/AC ratio below 1). Nb: Mixed orientation are only applied to different strings, not on different modules within a string. Since you can individually assign strings to each MPPT inputs with Huawei, the concept of mixed orientation is redundant and often misleading. In future releases, the mixed orientation option may not be possible anymore with Huawei, and you will have to separate your subarray into two, each with its own orientation.
-
 Phuong Nguyen joined the community
 -
I can't generate the .CSV output from the simulation. I've tried several command generation combinations in the CLI command generator, but every time I try, I get the error message "Output CSV file generation failed." I really don't know what else to do and I'm concluding it's a PVsyst CLI bug. The PDF report is generating normally. See a print of the process.
-
 Hello everyone, I am working with PVsyst simulations and I would like to know how I can evaluate the losses associated with grid voltage variations on the inverter. My understanding is that when the AC voltage deviates from the nominal value, the inverter may increase the current to maintain the power, which could lead to limitations or losses. Is there any specific parameter or report in PVsyst that shows these losses due to operation outside the nominal grid voltage range, or should they be analyzed indirectly through "grid limitation" or another indicator? In addition, is it possible to analyze this effect in graphs or specific reports within the software, and what type of analysis could be obtained to quantify it?
 -
Hello, I noticed a error when using Huawei 30/40/50KTL-M3 with MERC-1100W-P optimizers. According to the MERC-1100W-P manual, the maximum power of an optimizer string is 20kWc. In my configuration I have a Huawei 30KTL-M3 with 2 strings of 36 450Wc panels (18kWc per string), which should be accepted by PVSyst but I got this error. How can I overstep this PNom ratio limit ? Thank you in advance, Best regards
-
Hello, Yes if you are defining the MPPTs you have an interest to use the Auto-equal Pnom option, to avoid overload losses in some sub-arrays while other underperform. If you have multiple orientations, you can use the multi-orientation daily sharing option. Kind regards,
-
merci pour votre aide, j'ai pu avancer sur le problème, juste que maintenant, après configuration de la moyenne de l'orientation, le problème persiste.
-
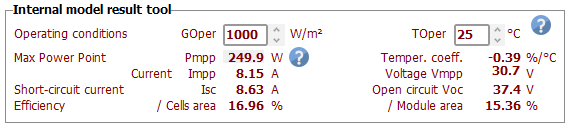
 Export the data (values) from the graphs and you will get short circuit values for V and I.
 -
Hi Linda, Thanks for the reply! May I ask if its always the case for MPPT sharing, to use Auto-equal. Pnom option? Thanks, Aidenn
-
The PV module efficiency is the power generated by the PV module, divided by the power reaching the module in form of light. The generated power is calculated with the single diode model for the given external conditions (irradiance and temperature), while power in form of light is just the irradiance times the surface of the PV module.
-
I don't see what you mean by "some modules are overlapping". For filling your field, you can do that manually by the mouse. But you can possibly use the option "Attribution automatique" (you have many options for doing this), and than correct what seems not suited for you, by exchanging/dragging the string attributions with the mouse.
-
PVsyst doesn't provide a plot for this variation, because the Voc is not of big interest for the simulation. You can get the results of the model for any Irradiance and temperature conditions, in the PV module definition dialog, main page, "Internal model result tool":