All Activity
- Today
-
 Samar joined the community
 - Yesterday
-
 Rebero Fabius joined the community
 -
 Mary123 joined the community
 -
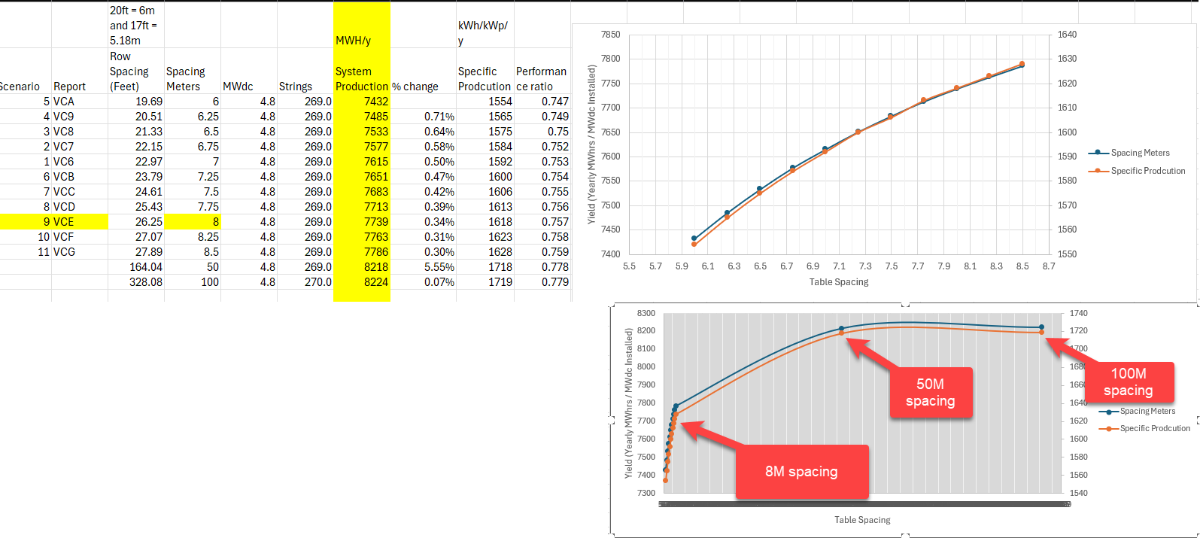
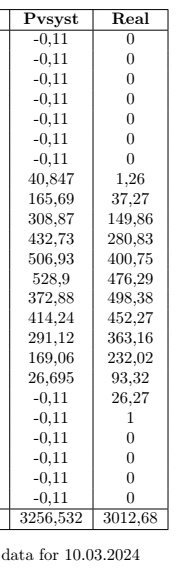
 I fully expected energy to plateau as you mention dtarin. Perhaps my variant comparison above was confusing- so I have added some annotations below to help better explain my concern. At 50M, there should be very minimal row-row shading with of course the exception in the early / late parts of the day. To your point, we should not see an appreciable yearly energy increase. This "plateau does not occur until roughly 50m. @Michele Oliosi I did add the suggested shading loss to the 8760 data and plotted in excel. I do not see a significant change here. I can share my model - can you suggest a method for file sharing?
-
 dkxzzz joined the community
 -
 We are witnessing error in tracker angular movement. For example, at a specific time, tracker is supposed to be at an angle θ, tracker is actually at an angle of θ+/- 5Deg. Is it possible to do PVSyst simulation with tracker rotating angle error of +/-5deg to check generation loss due to tracker tracking angle error
 -
 Backiyaraj joined the community
 -
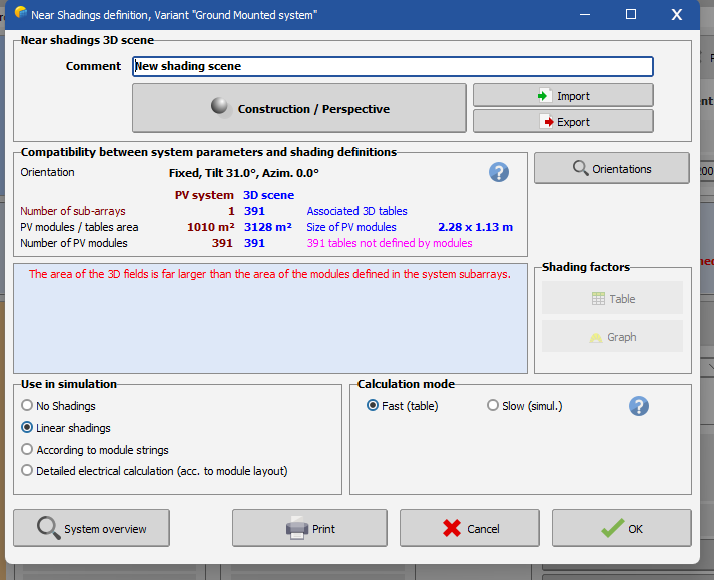
 I'm unable to solve this error even though I have the same number of PV modules both in my system as well as in my 3D scene. Please advice.
-
RahSolar joined the community
- Last week
-

Inverter output power by .OND file
André Mermoud replied to Andrés Fernández's topic in PV Components
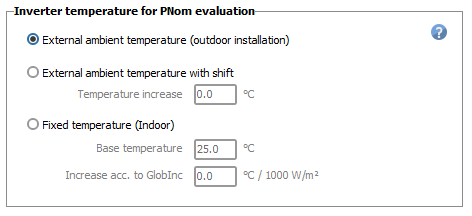
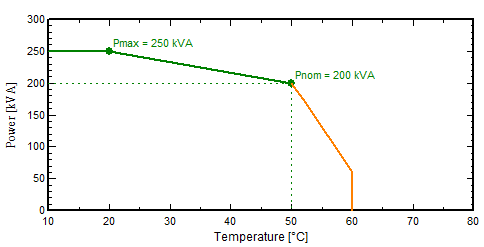
When you have a nominal power, defined up to a given temperature, say 50°C, and an enhancced maximum power up to lower specified temperature, say 20°C, the simulation will use the curve shown in the inverter's definition dialog, page "Output parameters": The inverter temperature to be used during the simulation is defined in the "Energy management" dialog: Now the efficiency curve is specified by points at different powers, and interpolated between these points at each time step. If the actual power is over these points, the efficiency curve is simply extended linearly.
-
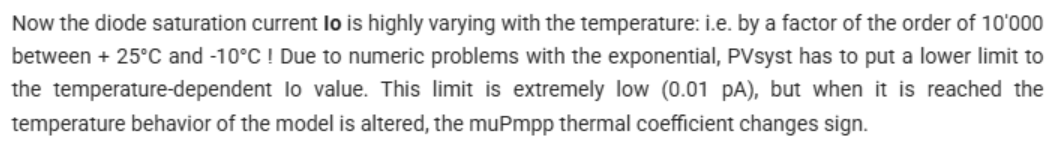
After posting this, I realized the documentation may be referring to the saturation current evaluated at the actual cell temp, rather than the reference value. Is that the case?
-
In PVsyst's documentation, it's stated that due to computational problems, PVsyst requires that the saturation current of a module at STC (I0_ref) be at least 0.01 pA, or 1e-14 A. However, after playing around with the single-diode parameters of modules in PVsyst, it seems like in reality the minimum saturation current of a module is 0.01 nA, or 1e-11 A. This is 1000 times greater than what is stated in the documentation. Is the value quoted in the documentation an error? Or is there something else going on here? Attached is a screenshot of the documentation text for reference.
-
If February 29th is missing from a leap year weather dataset, does it affect only that specific day, or does it impact the rest of the year as well? For example, when importing NSRDB weather data for 2020 (a leap year) into PVsyst, but excluding February 29th from the dataset: Does the PVsyst output for March 1st still correspond to the actual March 1st? Or does PVsyst treat the March 1st data from the file as February 29th, thereby shifting all subsequent days? Additionally, when running PVsyst for a specific year, does the software calculate the sun position based on that exact year (e.g., accounting for leap years), or is the sun position fixed for each calendar day regardless of the year?
-

PVSyst report with HV transformer and HV transmission line losses excluded
Aidenn replied to Aidenn's topic in Simulations
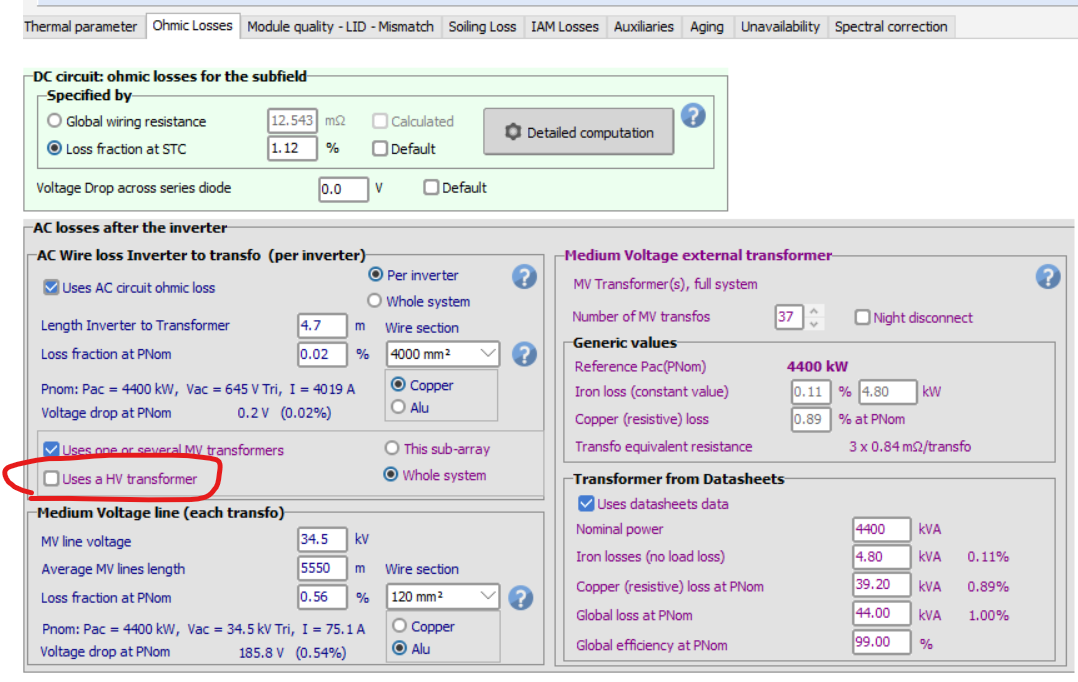
Hi Linda, There's already a PVSyst file with all inputs are present. The request is to generate another report to have HV losses excluded. Is unticking this box the correct way to exclude the HV losses? (see image below)
-
 Hello, Per default there are no HV transformer or transmission losses included. You can define transformers in the detailed losses window, ohmic losses tab.
 -
Hi, PVSyst report with HV transformer and HV transmission line losses excluded. How to do this?
-
the idea is the same for the limitation of maximum current per MPPT. The graphics in the system window is an approximation, not considering the backside production, though the simulation will.
-
Thank you. Now we have to wait for the answer of the inverter company 🙂
-
@Linda Thoren I clearly understand in terms of overload loss. However Inverter has limitation in terms of maximum current per MPPT and since the string sizing is only based on the front side Imp ,I guess the string distribution along MPPT has to be evaluated separately?
-
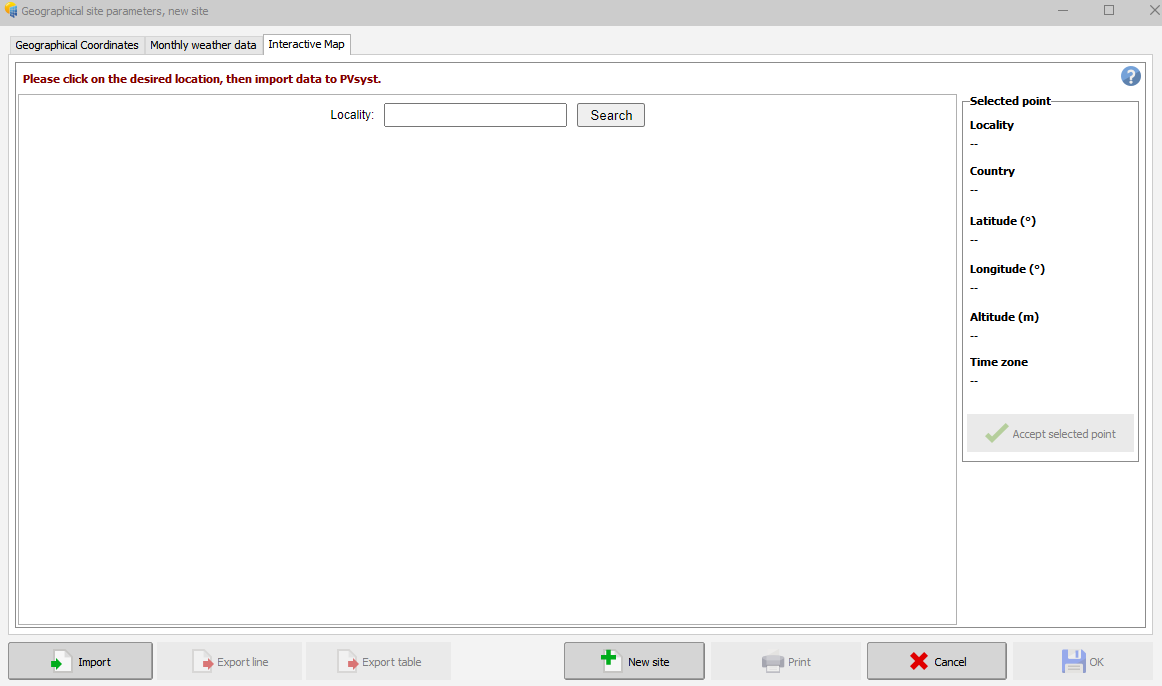
I don'n know. I tried to use the interactive map, but the map is not activated. What is the solution?
-
Dear Kanagavel, What would be your needs exactly ? It would be technically possible to map an API over the use of PVsystCLI but be careful with the fact that such a service should only be used by the company owning the licence, with respect to our Subscription Contract (paragraph 3.5)
-

Change in treatment of missing water vapor data for spectral correction?
LauraH replied to LauraH's topic in Simulations
Shoot, I started a new topic (Report shows spectral correction applied even when it isn't) when following up on this project. -
Report shows spectral correction applied even when it isn't
LauraH posted a topic in Problems / Bugs
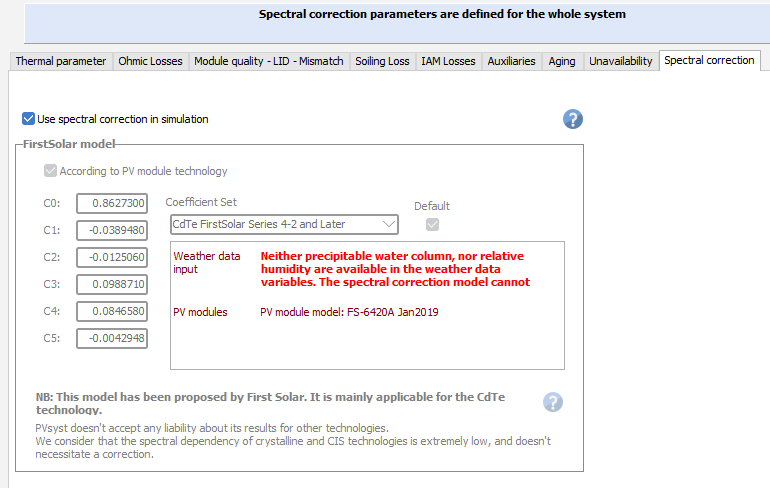
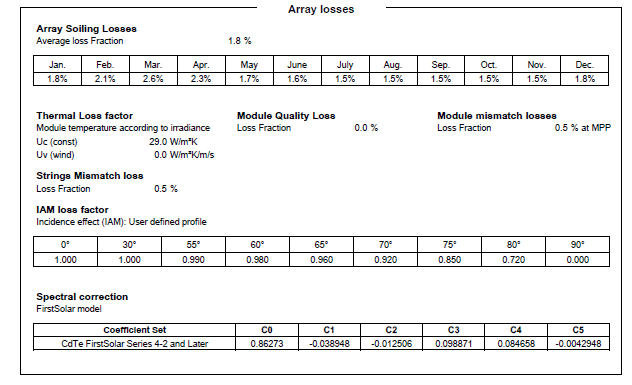
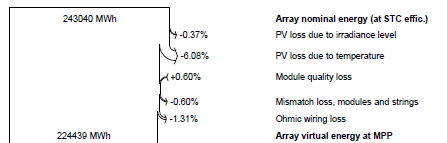
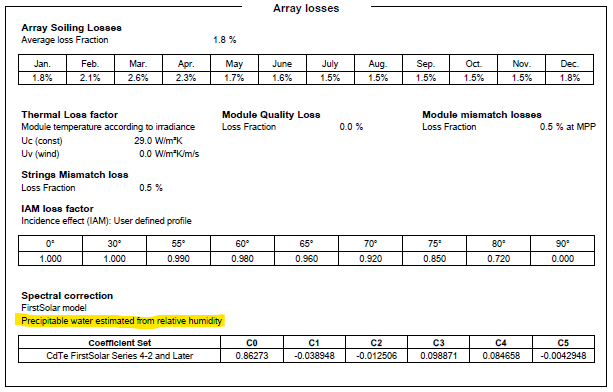
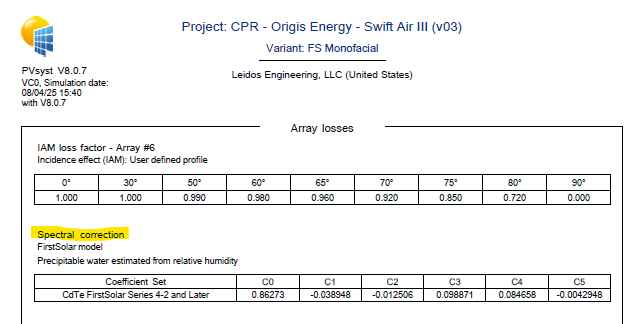
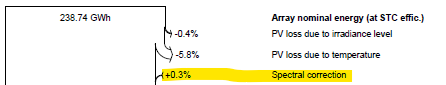
I'm not sure how I never noticed this before, but spectral correction is included in the loss inputs section of a PVsyst report even when the correction wasn't applied due to lack of any water vapor variable in the input met file. In this case, spectral correction is listed but there is no loss/gain listed in the waterfall diagram. I think this is VERY misleading and should be changed. Either take spectral correction out of the input loss list or put an error message where the data source is normally listed. The inconsistency makes it very difficult to figure out why no spectral gain/loss appears in the waterfall diagram when you know you turned on spectral correction. The issue is most likely to arise when modifying an existing project because the user may not check all the previous loss settings. All of the places where the spectral correction could be referenced in a PVsyst run that I can find are shown below for the case when spectral correction couldn't be run along with the input loss pane when RH is included in the met file.
-
Have you tried creating a copy of the SIT file in the Sites folder, to see if it shows up in the list?
-
Hi, Are we still not able to export SIT files in v. 8? I'm trying to upload a new met file for an existing project but can't pick the appropriate site because it's not in the list. I don't want to create a new site at the risk of changing the model. Any suggestions? Thanks, Laura
-
Hi, I recently noticed an odd difference between two PVsyst (v. 8 ) runs of the same model that used different resource data, as illustrated below. Both reports indicated that spectral correction had been applied, but only one mentioned the source of water vapor information. The waterfall diagram shows a spectral gain of 0.3% in the first case, but 0% in the second (there's no reference to spectral gain/loss in the diagram). How is this possible if spectral gain was applied both times? I'm suspicious that water vapor/RH wasn't included in the resource data upload in the second run, but wouldn't PVsyst throw an error in that case? At least it did in v. 7. Thanks!
-
Dear Pvsyst CLI team, Is it possible to API Interface with Pvsyst CLI Thanks & Regards, Kanagavel K
-
 oomar_d joined the community
 -
Hello, The values used in the system sizing serve only as a guideline and provide an order-of-magnitude estimate, considering only the initial front-side production (excluding for instance losses and rear-side generation). For an accurate assessment of overload losses, you should run a simulation.
-
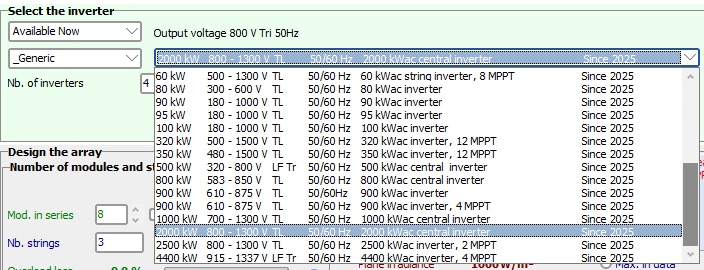
Among the Generic inverter in the database, you can find examples of central inverters. Here you see that there are no MPPTs. By opening the .OND file, you find this information in the Additional parameters tab.
-
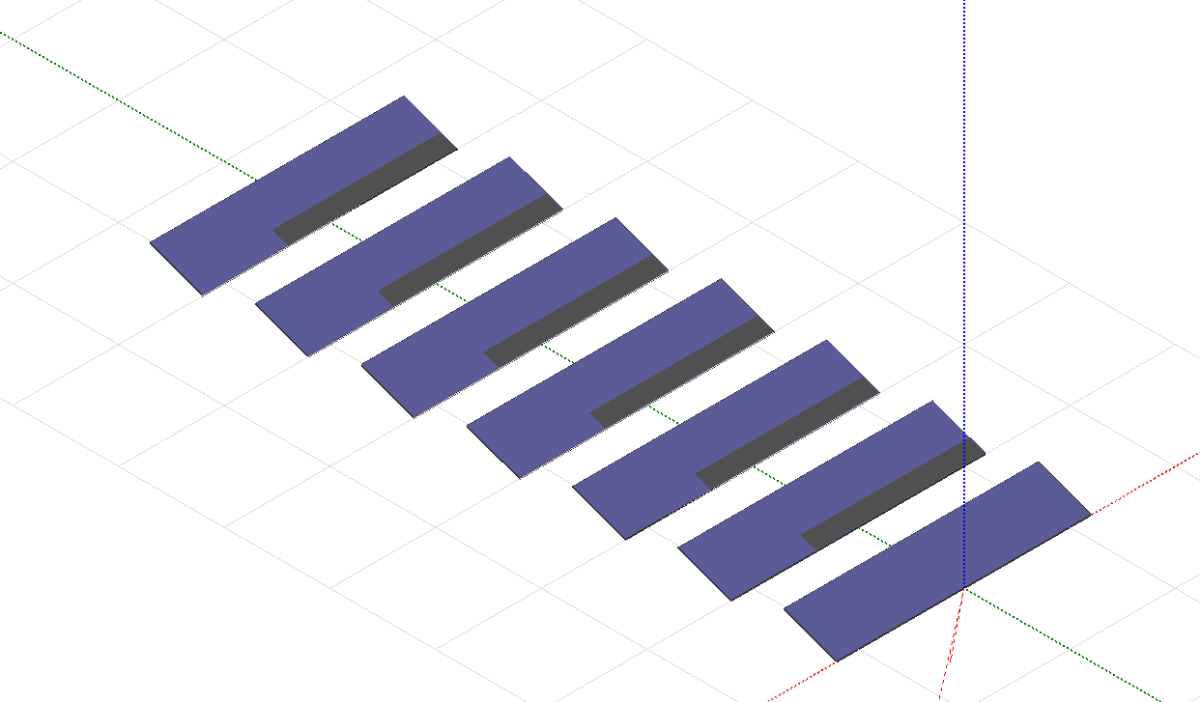
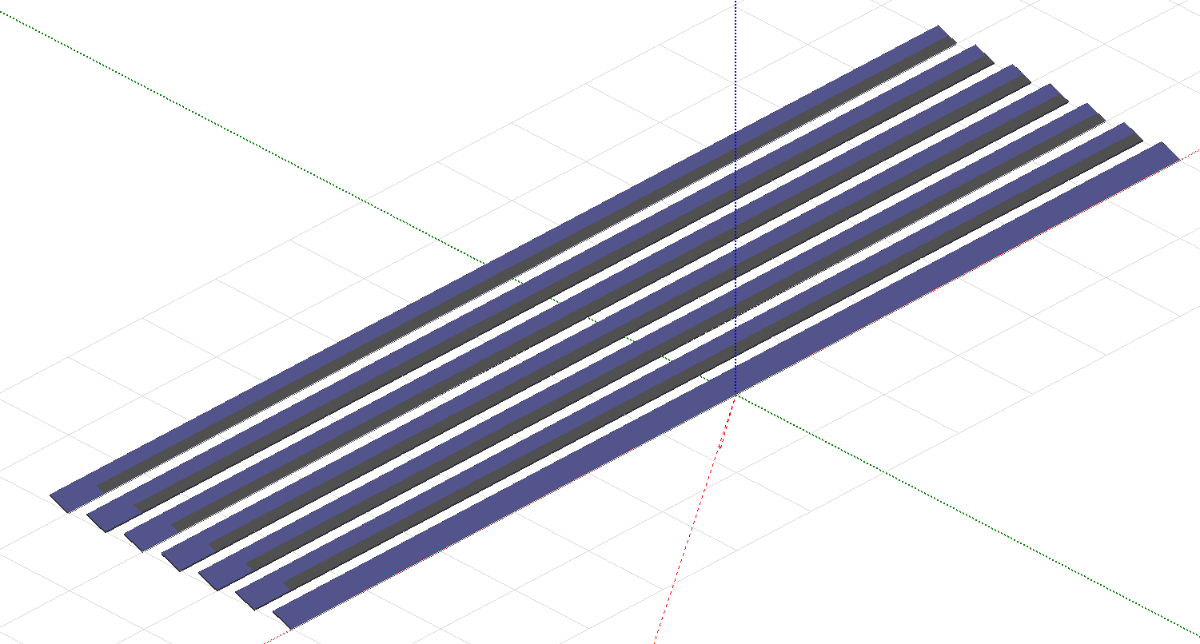
Indeed, the first row will not have any mutual shadings. For “unlimited” long tables, mutual shading can be applied uniformly across the entire row, allowing edge effects to be neglected. In the two images below, you can see an example, that for long tables, the impact of edge effects is limited to the lower-left corner and is therefore negligible. However, for shorter tables, this assumption becomes less valid.
-
 Hi, We were trying to decrease the file size of the report for a very complex simulation by decreasing the resolution setting to the lowest possible but the exported file doesn't seem to change at all even when setting it to max or min values. Is this not the correct setting? Thank you and best regards