All Activity
- Past hour
-
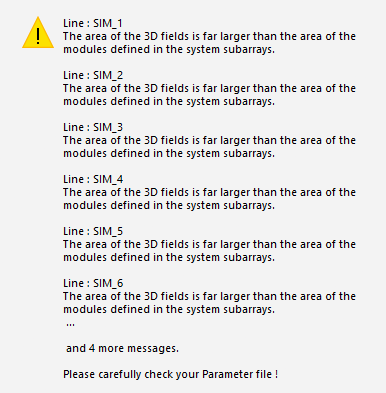
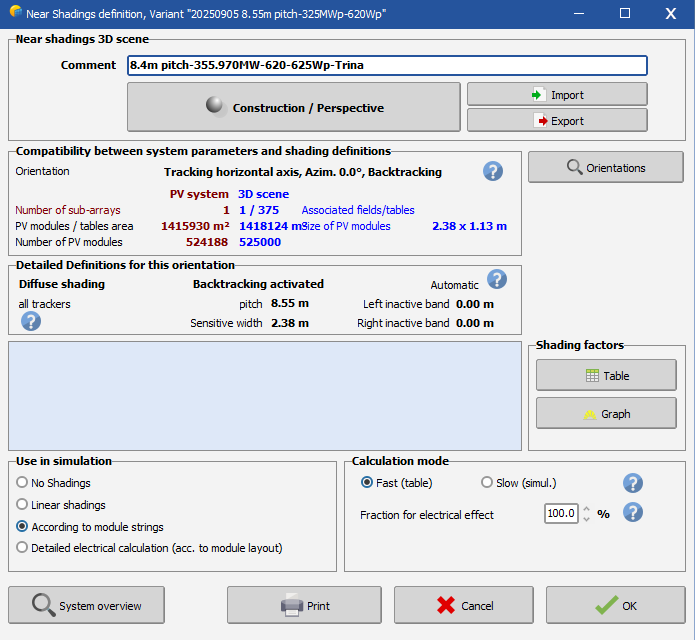
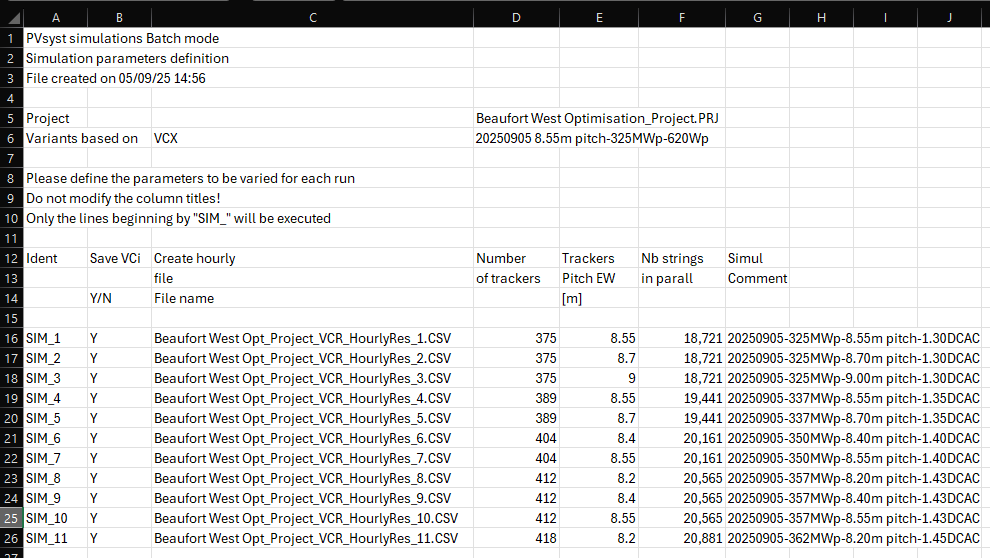
 I am getting the same error message when trying to run batch simulations. Any assistance would be appreciated. Images of error messages, Near Shadings screen and Batch file inputs included.
-
 Aniket4you joined the community
 - Today
-
Johan joined the community
-
Indeed, the final simulation result always corresponds to the full system. To view the results of the individual inverters, you would need to simulate each one in a separate variant. Depending on how AC losses are defined, the two individual inverters should produce approximately the same as when they are simulated together, although some post-inverter losses may differ due to the lower total system power. If your full system has two inverter before the injection point, this is how you should simulate the system, rather than adding variants together. Separating the inverters into separate variants is a work around to evaluate the individual inverter performance.
-
Just to follow up on this. Let's say my whole system has 2 inverters. If I want to know the output of each inverter individually, I need to do two variants, with each variant having the defined inverters of my system. Then, if I run that and extract the csv file, will the E_grid of the two variants add up to the E_grid of the variant for the whole system? With this, can I say that this is how I can proportionate the output of the inverters?
-
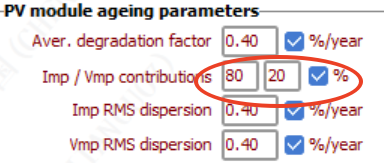
Dear PVsyst team: For the Imp/Vmp contributions 80/20%, is there any relevant literature to support the value of this parameter? Thank you!
- Yesterday
-
 baharak joined the community
 -
 First of all, the inverter's behaviour with grid voltage deviations is very rarely described in the datasheets, and probably different for each inverter. By the way, PVsyst doesn't treat possible Grid voltage variations along the time. This is not part of the input variables, and we really don't see from which source we could evaluate it in prevision simulations.
 -
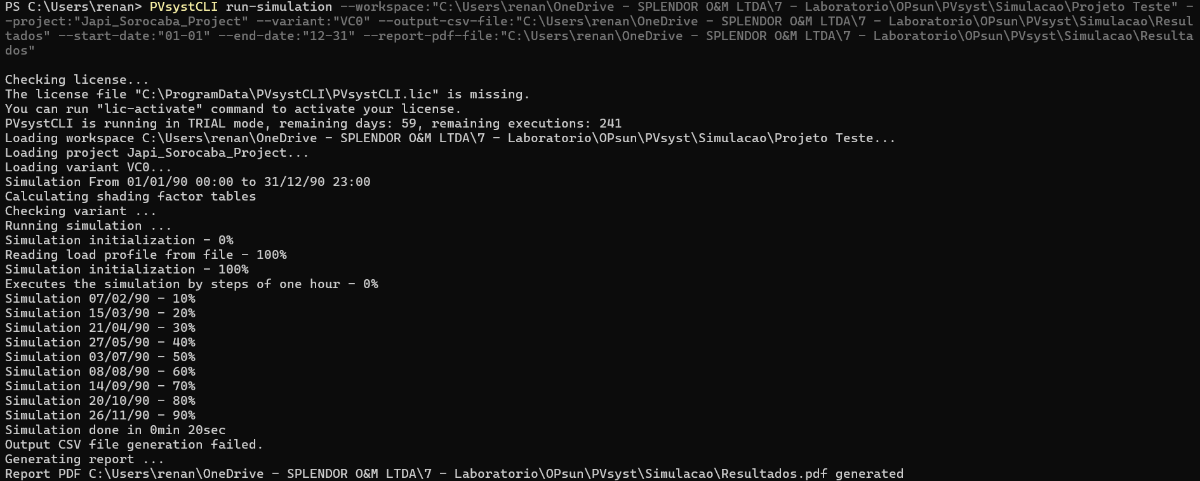
Dear Renan, Thank you for reaching out. For "--output-csv-file" and "--report-pdf-file" options, you need to specify the file name with extension, not only the folder: --output-csv-file:"C:\Users\renan\.........\Resultados\Results.csv" --report-pdf-file:"C:\Users\renan\.........\Resultados\Results.pdf" If the problem remains, please export your log files by using the command: PVsystCLI export-logs Once the logs zip file is generated, please send it to support@pvsyst.com Best regards.
-
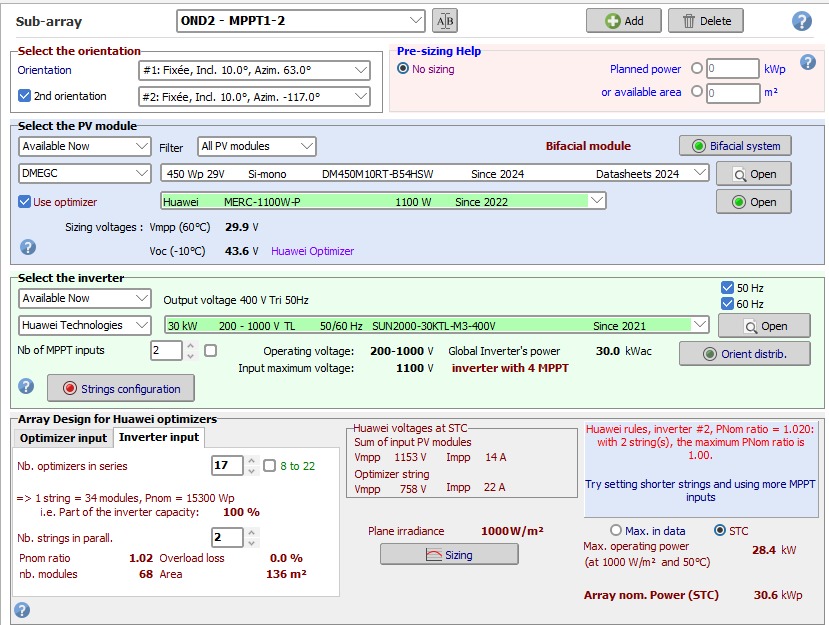
Compatibility rules between optimizers and inverters are implemented in PVsyst directly based on Huawei's requests. In this case, Huawei requested the maximum connected power to be limited to a certain DC/AC ratio. This is what is displayed in the message box: with only two MPPT input used, the maximum allowed DC/AC ratio is 1. Because you have a total connected STC power of 30.6kW, this configuration is not considered valid for Huawei. Huawei asked us to strictly enforce their rules, so there is no possibility to overstep this one. The only solution is to change your system somehow (configuring more strings, or slightly altering your inverter AC power or modules power so keep the DC/AC ratio below 1). Nb: Mixed orientation are only applied to different strings, not on different modules within a string. Since you can individually assign strings to each MPPT inputs with Huawei, the concept of mixed orientation is redundant and often misleading. In future releases, the mixed orientation option may not be possible anymore with Huawei, and you will have to separate your subarray into two, each with its own orientation.
-
 Phuong Nguyen joined the community
 -
I can't generate the .CSV output from the simulation. I've tried several command generation combinations in the CLI command generator, but every time I try, I get the error message "Output CSV file generation failed." I really don't know what else to do and I'm concluding it's a PVsyst CLI bug. The PDF report is generating normally. See a print of the process.
-
 Renan joined the community
 - Last week
-
 Hello everyone, I am working with PVsyst simulations and I would like to know how I can evaluate the losses associated with grid voltage variations on the inverter. My understanding is that when the AC voltage deviates from the nominal value, the inverter may increase the current to maintain the power, which could lead to limitations or losses. Is there any specific parameter or report in PVsyst that shows these losses due to operation outside the nominal grid voltage range, or should they be analyzed indirectly through "grid limitation" or another indicator? In addition, is it possible to analyze this effect in graphs or specific reports within the software, and what type of analysis could be obtained to quantify it?
 -
Hello, I noticed a error when using Huawei 30/40/50KTL-M3 with MERC-1100W-P optimizers. According to the MERC-1100W-P manual, the maximum power of an optimizer string is 20kWc. In my configuration I have a Huawei 30KTL-M3 with 2 strings of 36 450Wc panels (18kWc per string), which should be accepted by PVSyst but I got this error. How can I overstep this PNom ratio limit ? Thank you in advance, Best regards
-
 WDC joined the community
 -
Hello, Yes if you are defining the MPPTs you have an interest to use the Auto-equal Pnom option, to avoid overload losses in some sub-arrays while other underperform. If you have multiple orientations, you can use the multi-orientation daily sharing option. Kind regards,
-
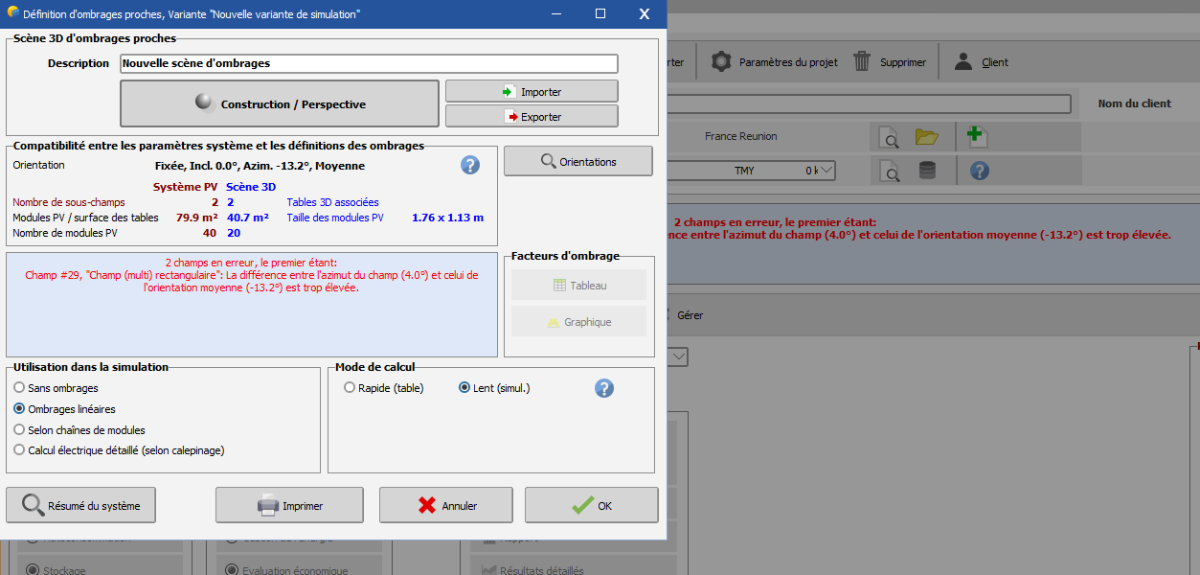
merci pour votre aide, j'ai pu avancer sur le problème, juste que maintenant, après configuration de la moyenne de l'orientation, le problème persiste.
-
 Export the data (values) from the graphs and you will get short circuit values for V and I.
 -
Hi Linda, Thanks for the reply! May I ask if its always the case for MPPT sharing, to use Auto-equal. Pnom option? Thanks, Aidenn
-
 Markmax6 joined the community
 -
The PV module efficiency is the power generated by the PV module, divided by the power reaching the module in form of light. The generated power is calculated with the single diode model for the given external conditions (irradiance and temperature), while power in form of light is just the irradiance times the surface of the PV module.
-
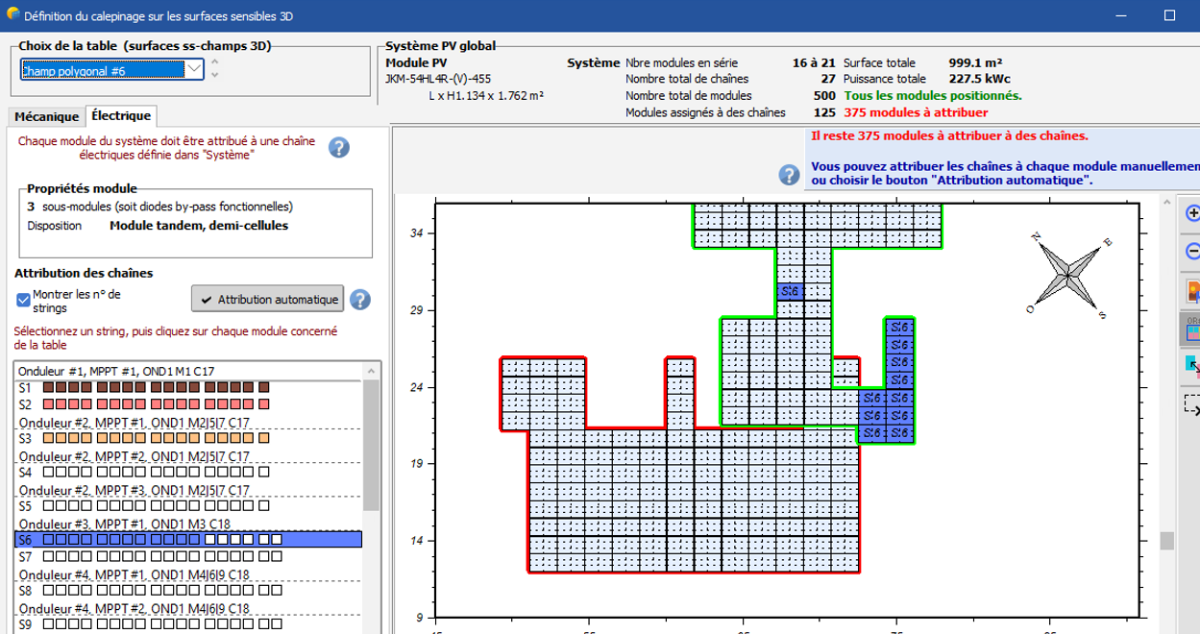
I don't see what you mean by "some modules are overlapping". For filling your field, you can do that manually by the mouse. But you can possibly use the option "Attribution automatique" (you have many options for doing this), and than correct what seems not suited for you, by exchanging/dragging the string attributions with the mouse.
-
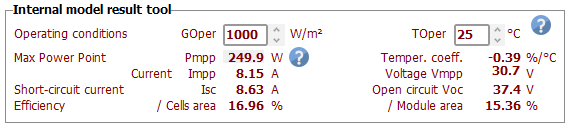
PVsyst doesn't provide a plot for this variation, because the Voc is not of big interest for the simulation. You can get the results of the model for any Irradiance and temperature conditions, in the PV module definition dialog, main page, "Internal model result tool":
-
 Hello, Indeed, this is not the expected behavior. Since the grid limitation is applied at the Pnom, we have observed that in certain situations—when the MPPTs operate under very different conditions—this may lead to results that do not perform as intended. To analyze your project in more detail, could you please export it as a .zip file and send it to our support team at support@pvsyst.com? We apologize for the inconvenience.
 -
The answers to your questions are fully explained in the help: https://www.pvsyst.com/help/project-design/array-and-system-losses/ageing-pv-modules-degradation/index.html?h=ageing https://www.pvsyst.com/help/project-design/array-and-system-losses/ageing-pv-modules-degradation/module-performance-degradation.html 1. - ISC dispersion has nothing to do with the datasheets information. Its nature is explained in the help. 2. - You can evaluate the effect of the Current and Voltage degradation weighting by yourself, by excuting several simulations. You will see that this is not very significant. 3. - When you have one only module, it is quite obvious that you don't have any mismatch loss. 4. - In the ageing process, the mismatch between "degraded" modules increases along the time. 5. - This is an input parameter. The global degradation is the sum of the individual PV modules degradation and the increasing mismatch.
-
Hello, when I’m doing the electrical layout, I notice that some modules are overlapping. Screenshot below. Could you tell me if there is a solution, because I can’t create a module string for the upper PV field.
-
Hello Michele, thanks for your answer. Could you specify which calculation method you use for step 5) ? I found several methods but not sure which one is correct. Can I calculate it out of hourly output values? Thanks for your help!
-
Bonjour, PVsyst ne permet pas la création de chaine de modules avec des orientations différentes, optimiseurs ou non. Si les deux orientations sont suffisamment proches, vous pouvez utiliser l'option d'orientation moyenne dans la scène 3D. La valeur de l'orientation utilisée pour la transposition sera celle de l'orientation moyenne, mais les ombres seront calculées sur la base de l'orienation réellement définie dans la scène 3D.
-
Dear Nicolas and Laura, Thank you for your post. We appreciate your feedback and your suggestions for improving PVsyst. Accessibility — including considerations for colour blindness and support for visually impaired users — is an important topic we are actively discussing, and we hope to bring improvements in this area in future versions of PVsyst. Regards, Eric
-
 I want to check how the Voc of a module changes at different temperatures and irradiance levels. How can I verify this? Although I tried the graphs section and the PV curve, I believe it is showing Vmp values instead. Please suggest how I can check the Voc of a solar PV module under these conditions.
 -
Bonjour, Je voudrais savoir comment définir un système PV avec des Optimiseur. le champs global comporte 2 orientations différentes donc nécessites des optimiseur, mais impossible de définir le nombre de panneau avec une orientation différentes. il y a une différence entre le système et la 3D.