nickSHIFT
-
Posts
3 -
Joined
-
Last visited
-
For those interested, A work-around is to find the User Optimization File or use the Batch Simulation mode, and manually plot the data in MS Excel. :)
-
I believe so. I think your pitch spacing at 5m is already large enough to not have any shading. Run it again from 1 to 5m and you should see a curve of some sort.
-
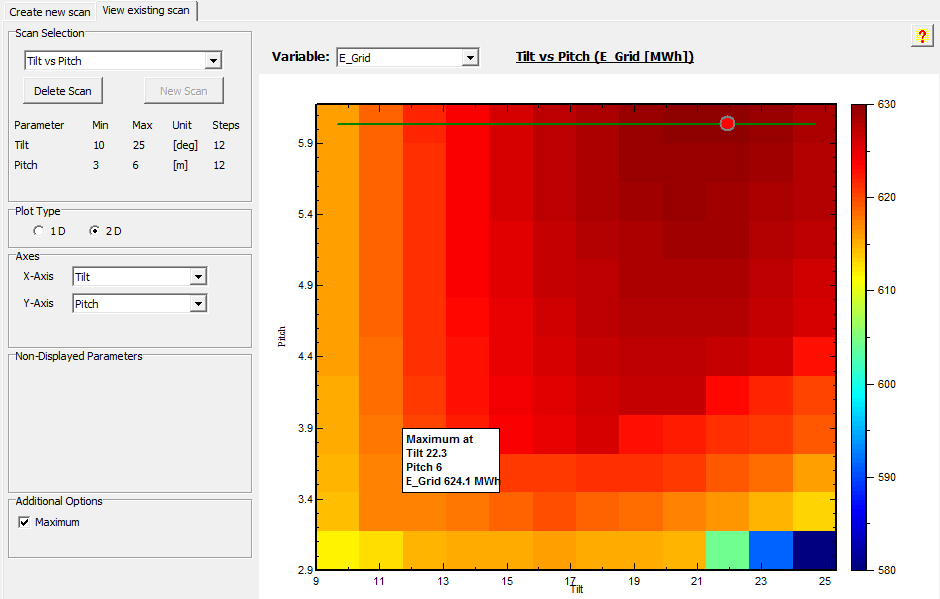
I have produced a few Tilt VS PItch scans, which are very helpful, but the units don't specify a time scale. EG: in the attached scan, maximum of 624MWh is produced, but over what period of time? My annual production is about 2200MWh. Is the 624MWh representing an average or total? It doesn't seem to fit with daily or annual numbers. Thanks. *Edit* I think this is possibly a glitch or it is missing some digits. Andre can you weigh in on this please?