LoicA
-
Posts
17 -
Joined
-
Last visited
-
Same for me : the PAN files are not visible. Very annoying issue.
-
Hello Mr Mermoud This is clear thank you. I also found some information here : Navigation PVsyst Help : Physical models used > Grid inverter > Inverter Model: Input and Output Best regards, Loic
-
Hi, I have one another question, It's about a different project, but still around IL_Vmin interrogations, Can someone explain me the IL_VMIN losses showed in the image below ? UArray > Vmin_Inverter (596V), so where does the losses come from ? Thank you in advance

-
Dear Mr Mermoud thank you for the answer, Ok it's more clear now. If I am right, GlobHor = BeamHor + DiffHor So Albinc = rho * (BeamHor + DiffHor) * (1 - cos i) /2 ? Regarding your explanation in "Physical models used > Irradiation models > The Hay transposition model", the calculation of the POA irradiation does not seem that much difficult. POA irrad = BeamInc + DiffInc + AlbInc = we have all the constants and variables needed I will read more stuff or try to work on the hourly PVsyst result to be more confident on this topic. Thanks, Loic
-
If I remember well the albedo visible by the array for the rows behind the first one, is equal to (n_rows-1)/n_rows * (Albedo of the first one). But I am not sure at all about that.
-
Hi, I am wondering how the albedo value is used by the process of POA irradiation calculation. Let's say we have 1000W/m² GHI. The albedo value is 0.2. Then, is the transposition process use 1000W/m² x (1+0.2) to determine the POA irradiation ? Thank you for your answer. Best regards, Loic
-
Hi If I understand well your question, yes you should be able to generate synthetic hourly data from this monthly data. That's a standard process. Loic
-
Dear Mr Mermoud, thank you for your answer. Ok for the 50%/50% ratio on the I and V impact. Anyway if we look at the T° between 12°C and 22°C according to the screen on the first post of this topic, the MPP voltage should be respectively 616.5V and 598.5V. So it's over the VmppMin 596V and with a not negligeable variation (616.5-598.5 = 18V). So why the voltage array is fixed at 596V? For your information the VMin 60°C is 531V. It could be interesting to show the V_MPP and I_MPP (I am talking about the MPP not the Array Voltage) somewhere in PVsyst in case of panel degradation. Is the Isc and Voc dispersion in the degradation part used in the calculation process ? I mean, are all the panel become differents when dispersion is applied, (V and I), or all the panel are the same and at the end (as shown on the diagram losses) a "Mismatch for degradation dispersion" is applied according to the Monte Carlo % results ? In the first case it's not easy to calculate the degraded V_MPP and I_MPP, in the second case it is and I can do it myself. Ok for the explanation of the negative Egrid and negative PR that makes sense and you are right we have defined auxiliaries losses and there are night losses.
-
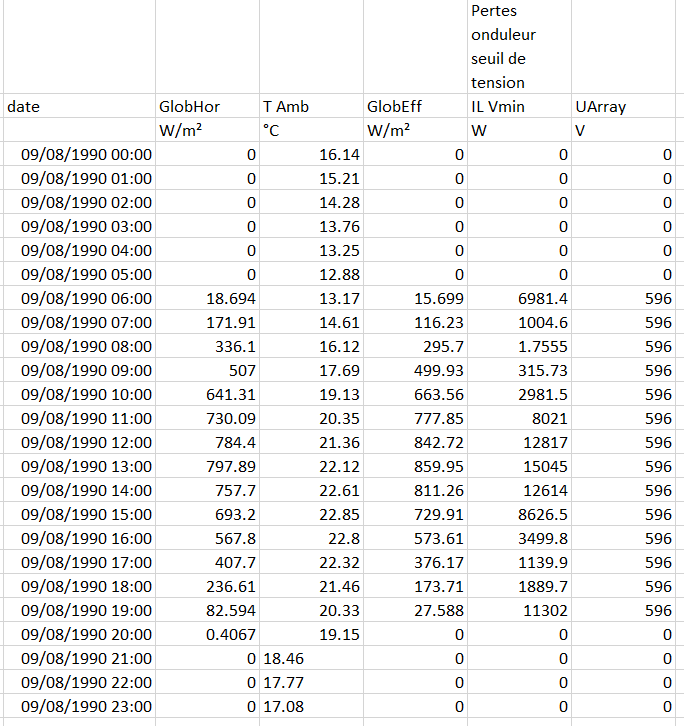
Hi I am studying the impact of panel degradation on the voltage and thus the voltage threshold loss (VMin 60°C). Where to find the value of the array voltage at 60°C the 20th year ? In the System window, the value shown does not take into account the degradation of panel power thus the panel voltage. In the Simulation -> Results > "Predefined Graph", it's possible to draw the "Distribution of array voltage" but it does not answer to my question and it's not easy to use. By using the hourly data I saw some values of voltage (see image enclosed) but two questions emerged : 1/ Why the voltage is constant over the day ? Both the T° and irradiation are varying. The value of 596V is the VminInverter, is there a coincidence ? 2/ Why some values of EGrid or PR are negative ? (not visible in the image enclosed). Thanks Loic
-
Hi Could it be the impact of the albédo loss due to the rows ? If you shift the rows so that they are not in front of each other, do you have the same results ? But interesting question...
-
Hi everyone, I am currently working on a project in the La Réunion island, we have a ground power plant there and we are doing the PVsyst again to compare with the real data. We have one "issue" or at least one "hesitation" about the horizon impact on the power plant (there are a couple of mountains there and the horizon line is about 8°). The meteo data available are one Meteonorm station (180km climatic distance...), PVgis; and why not the NASA SSE (not tested yet). I am wondering about the data of Meteonorm and PVgis : do they contain the horizon loss ? I have read all the data available on the forum and the PVsyst help but it's stil not clear. I hope it's correct but I understood that the data on Meteonorm and PVgis have a "horizon correction" according to your words. What does it mean ? Are they horizon free (higher value of irradiation) ? I have read one process about the management of the data to do a correct simulation including the real horizon line: -Use the monthly value with the horizon correction -Calculate the hourly data -Apply the horizon correction with the "original" horizon. What are the horizon correction process/calculation, and what do you call the "original" horizon ? -Generate the monthly value -Apply the horizon correction on these monthly values. Again, what is the horizon correction calculation ? At this step it seems that the data is horizon free -Generate the hourly data I would be really interested to have answers to these questions, Thank you in advance
-
Hi In the orientation part (first step before the System button) you choose tracker and select the box with Backtracking option. Then in the 3D scene you will have to select again backtracking if I remember well.
-
Hi everyone and Mr Mermoud, I have a very simple question easy to answer probably, I am currently reading the "Optimization of row arrangement in PV systems, shading loss evaluations according to module positioning and connexions" report written by Mr Mermoud. I read this : "The preceding calculations have been done using the "unlimited sheds" part of PVsyst, which uses the hypothesis that when the bottom cell is shaded, the whole string doesn't produce any electricity more." and the next sentence "That is, if you have one string in the width of the row, the system doesn't produce anything more except for the diffuse part." So, when using Unlimited shed, when one cell is shaded (or let's say one sub module), is there no electricity production or is there a production with the diffuse ? Is there any simplification when using Unlimited shed with the shading losses treatment, comparing to "According to string" or "According to module layout" 3D near shading options ? Thank you in advance.
-
Dear Mr Mermoud, thank you for your answer. What you said is true and I just realize that finally my point of view of drawing with a constant limit angle is not suited. What we could imagine is to design a plant on which each shed/row of tables have the same average shading losses, keeping a straight alinement of tables inside the same shed. Well, from now I will just try to manually do my best to put enough space between rows. One last question that was on the first post of this topic : Also, is there a way to convert the tables positioned using the Zone of Table tool to a Shed so that it’s possible to use the Optimization Tool? Best regards, Loic
-
Hi Soldnerkugel, Thanks for your answer, but I don't really see where it helps me :D I will nevertheless try to keep it in mind if I experience any issue with land surveyor data. Yes the PV plant is located in France. My questions were more about the way to position the tables with not flat lands using PVsyst. (To do it automatically and not manually). From what I know what is actually done is drawing the tables' positions with altitude using Helios3D and then importing this file into PVsyst. But Helios3D is very expensive, if used only to do this. So you are right, it's better to do the design in a CAD software and then do the yield estimation using PVsyst. Regards, Loic