fellanour
-
Posts
9 -
Joined
-
Last visited
-
Hi, please can fix the problem of plot the measured PR and Normalized performance from the tools option. Tools>Import ASCII Hourly file. Tools>Data tables and graphs, all variable can plotted correctely but Special Graphs for measured data its does not work correctely . thank you very much
-
Hi, i want to find the performances parameters (yf,ya,yr,PR)from measured data using PVsyst software. i used a Tools>Import ASCII Hourly file.after that i used Tools>Data tables and graphs, all variable can plotted correctely but Special Graphs for measured data its does not work correctely . are there any other methodes to find measured (yf,ya,yr,PR) in PVsyst. i had already 4 years stuck in this step. with every version of PVsyst i hope they fix that but the same problem . please any suggestion. thank you very much.
-
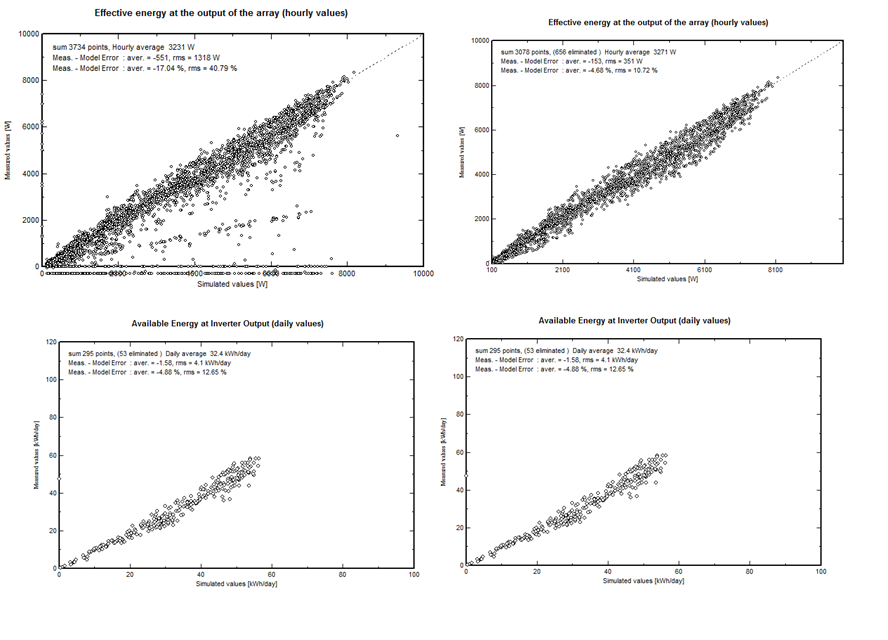
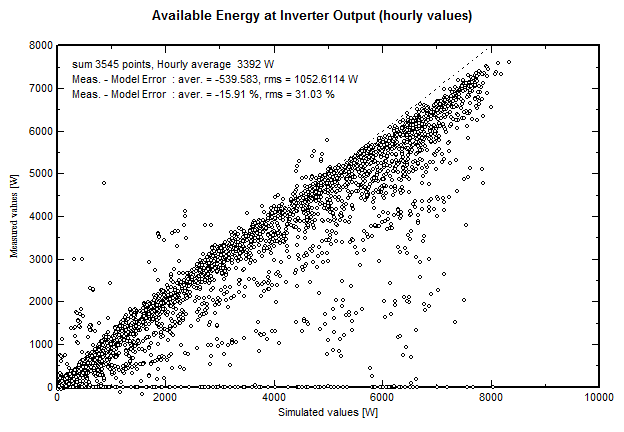
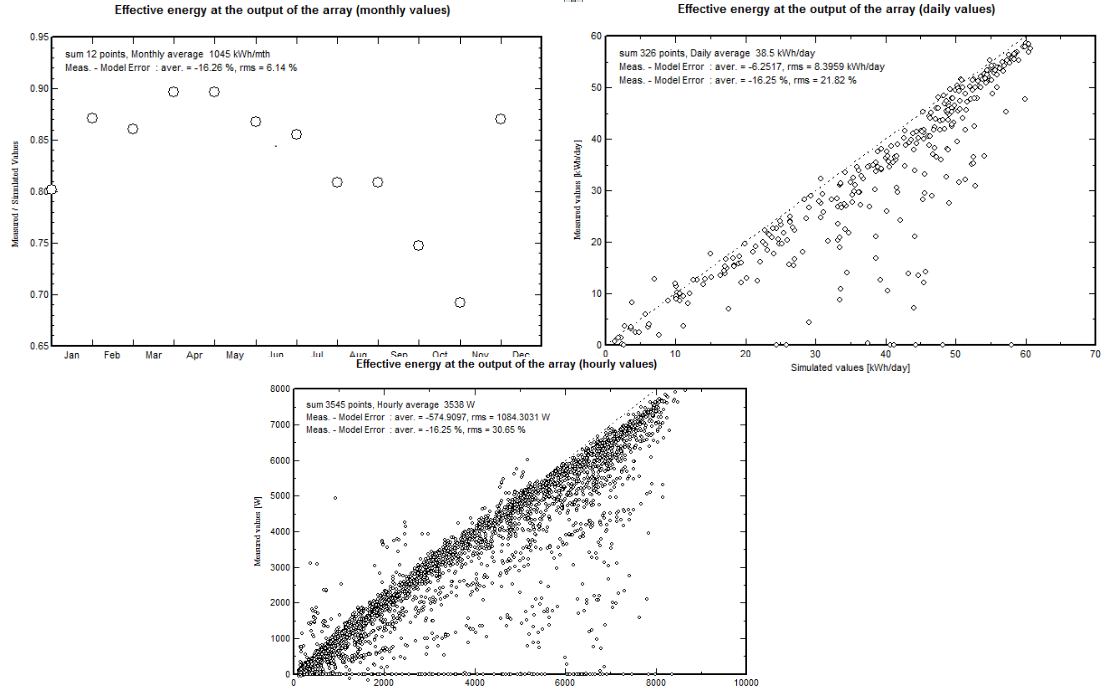
Dear user, I hope you can help me on this issue. I am comparing the measured data with simulated ones. after checking the Meteo data which seem good with average time shift in a clear day is 2. the RMS was 40% after elimination of erroneous data from the real data, it is still high 10 % as you see in the figure, any idea what I should check also. I really need some explanation why it is still the result not good. thank you

-
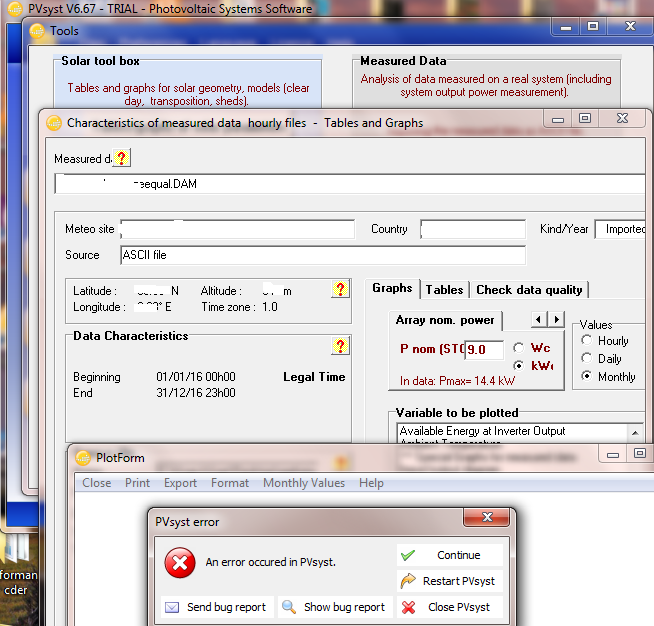
Dear Andre I try to use the trial version PVsyst6.68 to conversion of ASCII measured data I have (measured global on plane, measured module temperature, effective energy at the output of the array, effective energy at the output of inverter) usually, it works in the previous version but in this version, it gives me this error fig7 I note another thing is the date is not correct also. Best Regard
-
Dear users, maybe you can help me in solving my issue. I got measured values of one year from march2016_February2017. Using the "Import ASCII meteo file" tool in PVsyst. I started the conversion with 01_03_2016 file when the processes are in the decembre2016, it does not go to January 2017 it searches the January and February of 2016. thank you
-
When I use the tool>table and graph On Special Graphs for the measured data, I plot the Input/output diagram it works (fig 1) but when I try to plot (reference Incident Energy or Normalized production or production normalized factors or performance Ratio )it does not work and I get this message can you please tell why this happens this? thanks.
-
Dear Andrew and all user of PVsyst, I am currently trying to run a Measured data analysis using PVsyst. I am feeding measured data for one year (24 hr data) which is at 5-minute intervals using the sensor box of SMA inverter(there are some missing data). I have some issues : 1- I have data from March2016_October2017, the PVsyst run simulation only for one year.so I want to upload the measured data from March2016_February2017. I couldn't do it every time PVsyst try to find January and February of 2016.what I should do to let PVsyst accept some month of 2016 and some of 2017 2-when I upload the measured file and I check the data in ( "Data Tables and Graphs") I have this message "the clearness index of the best clear days is slightly low" in orange from the help of PVsyst seem acceptable to run the simulation or I should get message that result is good for simulation if yes what I should do to correct the data? 3-when we use the "Measured data analysis" the result of PR and normalized yield is it measured or simulated? I want to plot a comparison of measured and simulation of PR 4-I try to plot the PR and deferent yields from the measured file in "Data Tables and Graphs" but I get a message of "please define the array nominal power " after I define it I get the PVsyst error "An error occurred in PVsyst" i do not know how I fix this. Please can tell me how i solve this issues :cry: thank you very much Fellanour
-
Measured Data Analysis (Measured - Simulated Values)
fellanour replied to schatter's topic in Simulations
Dear Andrew, I am currently trying to run a Measured data analysis using PVsyst V6.30. I am feeding measured data for one year (24 hr data) which is at 5-minute intervals using the sensor box of SMA inverter(there are some missing data). The Issue that I have a big difference between the simulation and measured data (current array, voltage array, the effective energy output of array, the effective energy output of inverter ), I check the data in using( "Data Tables and Graphs"), it give me an acceptable message. Please let me know if you can provide any feedback. thank you very much Fellanour
-
How to compare the measured exported energy with the simulation?
fellanour replied to Sebastian.stan's topic in How-to
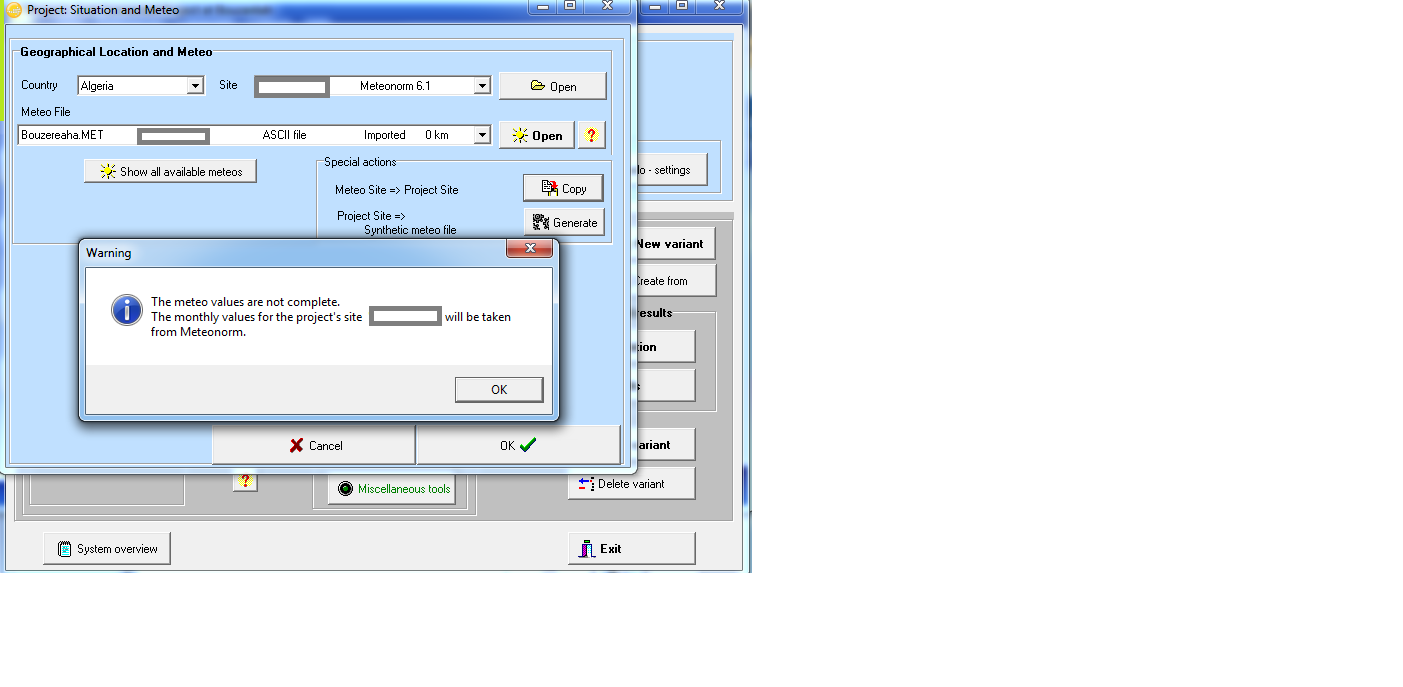
I'm trying to use the Measured data analysis tool for comparing the actual production of a PV system to the expected one from the simulation. The comparison is based on year of data . In order to import this data in PVsyst , i add the site to the geographical site in databases after i use the "Import ASCII Hourly file" my file includes the date, hour, measured irradiance on plane and ambient temperature . after the conversion i check the quality in `Meteo data`, the chift time is 6 minute every thing to be ok. If I try to import this file to simulate my system I get the error message "the meteo values are not complete, the monthly values for projects site ..........will be taken from Meteonorm` Please let me know what have to do ? Best Regards,