Dan Nicksy
-
Posts
11 -
Joined
-
Last visited
-
Hi Andre, I have a similar issue to PV Berlin. I am using PVsyst 6.68 and trying to import hourly data for GHI and ambient temperature. The conversion completes successfully, but when I check the data quality I also see the error: "The Ambient temperature is not defined in the data." Is this error message erroneous, and how do I get useable data imported? Thanks in advance for your help, Dan
-
I am having a simulation issue that I hope you can help me resolve. My simulation yields unrealistically high clipping losses as a result of MPPTs with uneven numbers of strings. I have the following stringing on a Huawei SUN2000-25KTL: • MPPT1: (2) strings of 330W = 11,880W; DC/AC overbuild = 1.43; 40% of DC capacity • MPPT2: (2) strings of 335W = 12,060 W; DC/AC overbuild = 1.45; 40% of DC capacity • MPPT3: (1) string of 330W = 5,940 W; DC/AC overbuild = 0.72; 20% of DC capacity • Total: 29,880W; 1.1952 DC/AC overbuild (I believe) PVsyst treats the three MPPTs on the SUN2000-25KTL as three independent inverters of 8.3 kWAC each, and clips each one individually. I have confirmed with the inverter manufacturer that the inverter does not limit power on an MPPT basis, but limits the power output of the inverter as a whole to 25 kWAC. My intention is to modify the OND file to use unbalanced MPPTs. I will define 40%+20%=60% of the capacity on the Primary MPPT (for 3 strings of 330W modules), and 40% of the capacity on the Secondary MPPT (for 2 strings of 335W modules.) In that way the DC/AC overbuild of the Primary and Secondary simulation-MPPTs will be the same as the DC/AC overbuild of the real-world inverter, and PVsyst will simulate clipping only when appropriate for the entire inverter. Can you confirm that this is an acceptable solution for PVsyst simulation, and would accurately represent the inverter as a whole? Is there any reason this would not provide accurate results? Note that for this simulation I am using the No Shadings option. Thanks in advance for your help, -Dan
-
Shading: Linear and Acc. to Module Strings Yield Same Result
Dan Nicksy replied to Dan Nicksy's topic in Problems / Bugs
Thanks for the explanation. Now at least I understand why I'm getting these results. -
Good afternoon all, As a starting point, I have read and understand the post "How to define the "mismatch loss" parameter" in the FAQ section of the Forum (http://forum.pvsyst.com/viewtopic.php?f=29&t=47&p=47&hilit=mismatch#p47). In doing some independent research, I have come across the idea that mismatch in a PV array is due not only to differences in current and voltage properties of individual modules in a string, but also caused by variations in irradiance and temperature in different parts of the array. I have two questions: 1) Please confirm that this irradiance and temperature mismatch is not accounted for in the PVsyst "Detailed Calculation" of mismatch button. 2) If I decide to include some amount of mismatch for irradiance and temperature, is it appropriate to include it in the Mismatch Loss parameter, or is there a more suitable way to include it in the simulation? Thanks, Dan
-
Shading: Linear and Acc. to Module Strings Yield Same Result
Dan Nicksy replied to Dan Nicksy's topic in Problems / Bugs
Update: I've done some digging and discovered the following two anomalies: 1. At some points throughout the day, the "Shading factor according to strings" is zero even though there is shade cast on a "string" i.e. partition of modules. In Fig1 and Fig2 there are 14 modules in a single shed partitioned into two strings and the shading object is 0.5x0.5x0.1 metres, centred at (0, 0, 0.15 metres). Fig1 shows the simulation performing as expected; Fig2, one half hour timestep later, shows a non-zero linear shading factor and a zero shading factor according to strings. It seems that the shading factor according to strings goes to zero whenever the south-most "string" has shade cast in its middle, but the shade does not touch any edge of the partition. 2. If the bottom of a shading object is higher than the panels (in the Z-direction) then the object may not contribute to the linear shading. Fig3 shows three shading objects; the bottom of the two on the right is higher than the panels. These objects to not cast linear shade on the panels (shown as yellow rather than grey). In Fig4 the same objects have been extended downwards so that the bottom of the objects is below the height of the panels; now they cast shade on the panels. Are these known issues? Has anyone else reported these problems? Note: I'm aware that it is unusual to have shading objects that are a) this close to an array, and b) directly above the array. However, this is a real-world problem I'm facing involving a pre-existing array and a landlord installing some new HVAC equipment, and I'm trying to model it appropriately.
-
Shading: Linear and Acc. to Module Strings Yield Same Result
Dan Nicksy replied to Dan Nicksy's topic in Problems / Bugs
In my original model I partitioned in module chains as you suggest; in the "Partition In Module Chains" dialog box I set the rectangles so that one rectangle represented one full string of modules. I was surprised to see that the shading loss was so low, and that the "Shadings: Electrical loss according to strings" value was zero. I conducted two further tests to help clarify the issue. 1) Ran the model with Shading Loss as "Linear". The annual production value was identical. 2) Used the "Partition in Module Chains" dialog box to set the rectangle so that one rectangle was used to represent the entire array. My understanding here was that if any part of the partition was shaded, the entire thing would be electrically inactive. I understand that this is not representative of the physical situation, but was trying to test the PVsyst model to determine where my problem was. I expected to see a significantly reduced energy production value, but instead the model yielded the same production as the "Linear Shading" simulation and the original "According to module strings" simulation where the array was partitioned such that one string was represented by one rectangle partition. -
Shading: Linear and Acc. to Module Strings Yield Same Result
Dan Nicksy replied to Dan Nicksy's topic in Problems / Bugs
The factor, "Shadings: electrical loss according to strings" is zero in the waterfall diagram when the simulation is run with Near Shading according to module strings. I understand that the "linear" loss will be the same in each case, but am still confused why there is no further loss associated with the module stringing. -
Good afternoon, I have created a PVsyst model, including a near shading scene (NSS). Modules are installed flush mounted to a low-slope roof; I have modeled this as follows: Nb. Sheds = 1; Nb. X Modules = 39; Nb. Y Modules = 15. In order to represent individual strings within the array, I have partitioned according to module strings as follows: Nb. String in X = 3; Nb. Strings in Y = 15; Fraction for Electrical Effect = 100%. It is my understanding that this divides the shed (39 modules by 15 modules) into 45 strings (13 modules by 1 module each), and that if any part of a string is shaded, that entire string is treated as electrically ineffective (i.e. does not generate any power); I recognize that this may be overly punitive. The roof has a number of air conditioning units and ducts, modeled as elementary shading objects (parallelepipede, portion of cylinder). I ran the simulation three different ways: No shading, Linear Shading, Shading according to module strings. I found that the shading loss was identical for both Linear Shading and Shading according to module strings; I verified this by outputting hourly Shading Loss to CSV. In order to test how PVsyst was behaving, I partitioned the entire shed (39 modules by 15 modules) into a single partition, such that if any part of the shed was shaded the entire shed should be electrically inactive. Again, I found that the simulation run with Linear Shading and Shading according to module strings yielded identical values. Am I misunderstanding the "Partition in Module Chains" or the "Fraction for Electrical Effect" functions? (I have read the help documentation on both topics) Is this a known occurrence in PVsyst V6.39? Is there a justifiable reason that the production should be the same between Linear Shading and Shading according to module strings? Thank you in advance for any help you are able to provide, Dan
-
Good afternoon, I am struggling to import meteo data measured on one of my sites. I have broken the time-stamp down into individual comma-separated-columns for: Year, month, day, hour, minute For example, noon on June 3, 2015 is represented as: 2015,6,3,12,0 In the ASCII Import Tool am using the Date format: Month | Day | Hour | Minute and have assigned month, day, hour and minute to the appropriate columns within the .MEF conversion format protocol file (as well as my irradiance and temperature values, obviously). When I "Start Conversion" and generate the meteo file, PVsyst confuses the day and the year. As a result, the above shown line (2015,6,3,12,0) is interpreted as noon on June 15, 2003. As a result, my imported data (which actually runs from June 3 through June 10 of 2015) is imported as though data were measured on June 15 2003, June 15 2004, ... June 15 2010. Obviously the sun geometry calculations are slightly off, and the results skewed. I have tried using different Date Format options, including options which allow me to explicitly specify the year and options the "Day of Year" option, but continue to encounter this issue. Can you please help me understand why this is occurring?
-
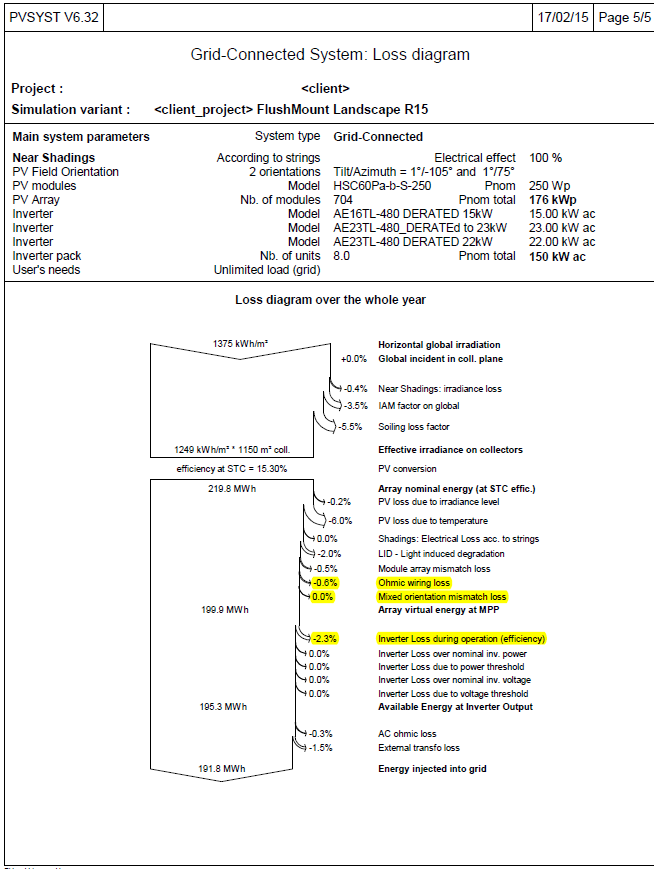
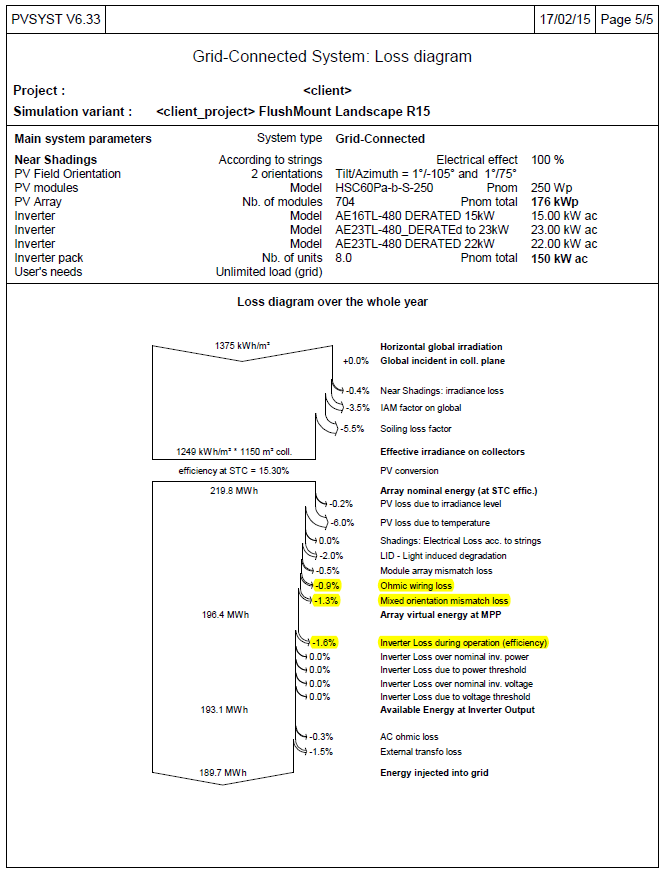
Energy Production Discrepancy -- V6.32 to V6.33
Dan Nicksy replied to Dan Nicksy's topic in Problems / Bugs
Thanks for the clarification. I look forward to the next updated version. Cheers, Dan -
Good afternoon all, Some time ago I created a PVsyst model for a site using PVsyst V6.30. The model uses string inverters, and a number of the string inverters have modules in two different orientations. Where necessary, the Orientation "Mixed #1 and #2" was used in the System parameter definition. The calculated specific production was 1190 kWh/kWp/yr. Recently I re-ran the model using PVsyst V6.33. I used the same files (PAN, OND, SIT, MET) and the same variant, but the calculated production was lower: 1178 kWh/kWp/yr. In order to isolate the problem, I ran the variant in different PVsyst versions. PVsyst V6.30 through V6.32 calculate a specific production of 1190 kWh/kWp/yr, whereas PVsyst V6.33 and V6.34 calculate a specific production of 1178 kWh/kWp/yr. In the Loss Diagram (see attached), the changes from V6.32 to V6.33 are shown: DC ohmic wiring loss increases, mixed orientation mismatch loss increases (from zero), and inverter loss during operation (efficiency) decreases. I reviewed the PVsyst Software Development change-log, and to my understanding nothing there explains this discrepancy. Can anyone help me understand this change between versions? And, most importantly, which version is more accurate? Thanks in advance for any and all help, -Dan