
-
Posts
32 -
Joined
-
Last visited
-
This tool is meant to compare .MET files, you first need to create several .MET files using different data sources
-

Bifacial Performance Ratio Formula in PVsyst V7 Help Menu
Auriane Canesse replied to kjs55's topic in Suggestions
Thank you for the report. Note that this bug was corrected in PVsyst 7.2.17 https://www.pvsyst.com/help/release-notes/index.html#exec-1--version-7217 -
You are correct, DTArrGl is weighted using GlobEff but it is computed as follows: DTArrGl = (T_Array - T_Amb) / GlobEff Note that it is only calculated for GlobEff > 7W/m2 and set to 0 otherwise as it becomes insignificant for very low irradiances.
-
We also have a comparison of different data sources available here, although we cannot possibly cover all countries: https://www.pvsyst.com/help/meteo-database/import-meteo-data/data-source-comparison.html#comparison-between-several-data-sources-for-different-continents If you need a more precise estimate for the locatiosn of your choice, I advise to get dat from different providers and compare the weather files using our comparison tool https://www.pvsyst.com/help/meteo-database/compare-meteo-data/index.html
-
I am not sure I understand your question. If you are looking for PVGIS 5.3 data using the SAHARA3 model, you can just download it from here: https://re.jrc.ec.europa.eu/pvg_tools/en/tools.html
-
Help : Warnings during the initialization HUMIDITY ???
Auriane Canesse replied to Nikoloz's topic in Meteo data
The precipitable water data is used to estimate spectral corrections in some cases. https://www.pvsyst.com/help/project-design/array-and-system-losses/spectral-correction.html?h=spectral#first-solar-spectral-correction-model-management If that data is not present in the weather input, relative humidity is used instead. This warning is more of an information. -
Yes that is correct
-
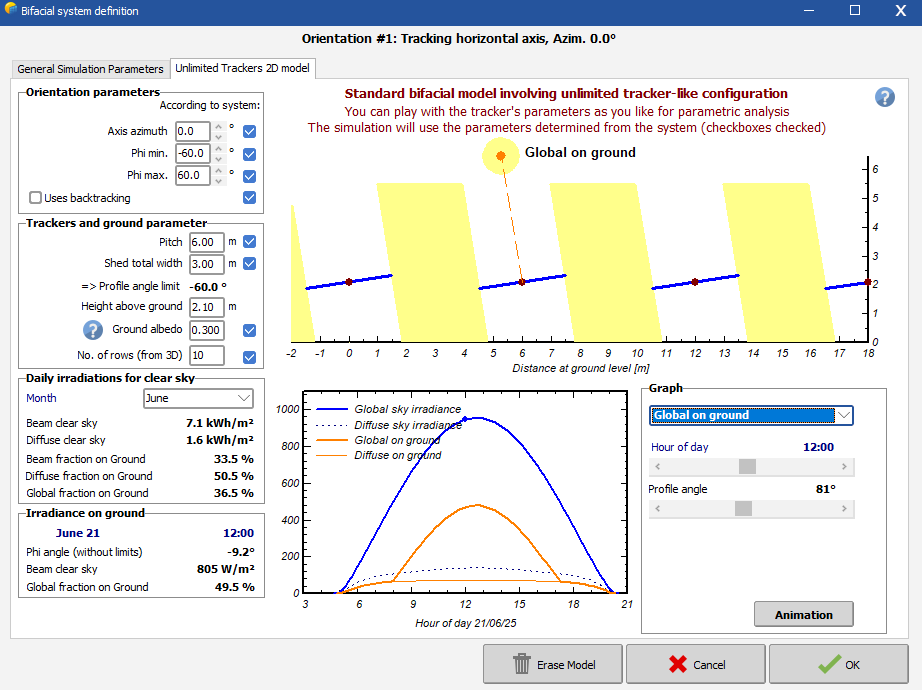
That's an interesting approach but I am surprised by the mismatch. It looks to me like the RPOA (darker curve?) was measured on a tracker and the fitted ones (brighter red?) are done for a fixed tilt setup. Or one is backtracking and the other is not? Maybe cross check the tracker definition in the bifacial window. If you have a complex setup, make sure the parameters here match the one tracker your RPOA measurement is installed on.

-
From a rear side measurement of the POA, you still have to apply a shading factor corresponding to the torque tube, cables, etc ("structure shading factor") in order to compute how much light effectively reaches your panel. This effective light corresponds to GlobBak. All relevant irradiance for bifacial calculation are defined here https://www.pvsyst.com/help/project-design/bifacial-systems/bifacial-systems-results.html
-
I meant you have to change the date itself from 2059 to 2049 in your csv data before importing. The other files should not be changed. File name should not matter. If you struggle to do it, please send a request at support@pvsyst.com with your input csv data attached
-
Unfortunately, this is a known bug and I'll ping the developer team about it. In the meantime you should change the year from 2059 to 2049 when generating your .MET file for that year. It won't change anything when generating the TMY from your 10 files that they are labeled 2049-2058 instead of 2050-2059
-
Getting high quality irradiance measurements in the field can be difficult and the two main sources of errors we see from our users are: Shaded sensors, especially for trackers. This can be identified by comparing your data to clearsky expectation on good weather day, and looking for unexpected decreases. The pattern should repeat from one day to the next. Sensor misalignments, either in azimuth or tilt (or both). Even small discrepancies have an impact. If you can easily download POA irradiance from solargis, chose a clear day and download data for several azimuth and tilt values around your expected geometry. Then check if one of the alternative geometries fits your measured data better. If your sensor is misaligned, you can still use the data in PVsyst as we first decompose POA irradiance into GHI and DHI. You just have to use the real tilt and azimut when importing data.
-
How can I import a quarter-hourly meteo file into PVsyst?
Auriane Canesse replied to DiegoNav's topic in Meteo data
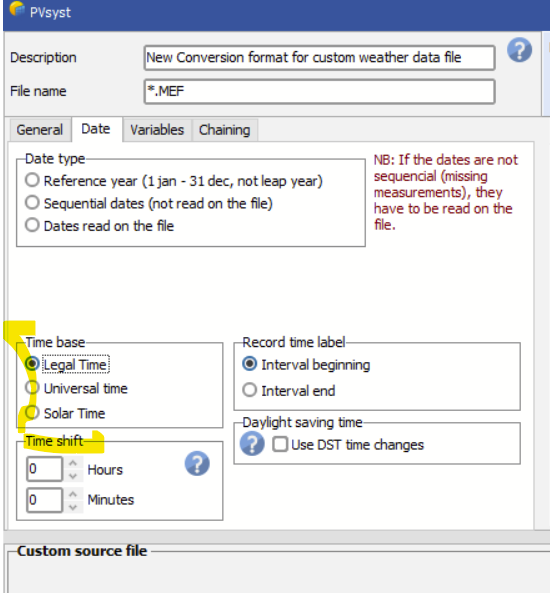
Did you try to define the time shift as indicated in the error message? You should also check that you have input the correct time reference If the time shift information you input is not taken into account or if non of the time base work, could you please sent your csv data file, .MEF file and PVsyst version to support@pvsyst.com so we can have a closer look at your problem
-
How can I import a quarter-hourly meteo file into PVsyst?
Auriane Canesse replied to DiegoNav's topic in Meteo data
You can import 15 min data via the custom file function of PVsyst. Just note that the data will be averaged and the simulation will still be in hourly steps https://www.pvsyst.com/help/meteo-database/import-meteo-data/custom-meteo-files/index.html Now for the merging part, you cannot do this in PVsyst. If you would like to use a mix a data sources, you should first create a .CSV file that has all your data. Please be careful when doing so that your data corresponds to the same place. But please also note that in your case having global horizontal irradiance and ambiant temperature should be enough to create a .MET file and run your simulation. There is no need to merge anything. -
That warning might be a bug, would you be able to send your .csv data and .MEF conversion file to support@pvsyst.com ? Did you read the dates on file or use the sequential dates option? But in any case, the PVsyst convention is that 31/12/20 at 23h00 corresponds to 23h00-24:00 so your file should indeed be complete