PVsystUser
-
Posts
36 -
Joined
-
Last visited
Everything posted by PVsystUser
-
Median P50 AC Energy vs. AC Energy Injected into the Grid
PVsystUser replied to kjs55's topic in Suggestions
I saw the help page below but E_Grid calculated based on TMY which itself is a statics entity. -
Median P50 AC Energy vs. AC Energy Injected into the Grid
PVsystUser replied to kjs55's topic in Suggestions
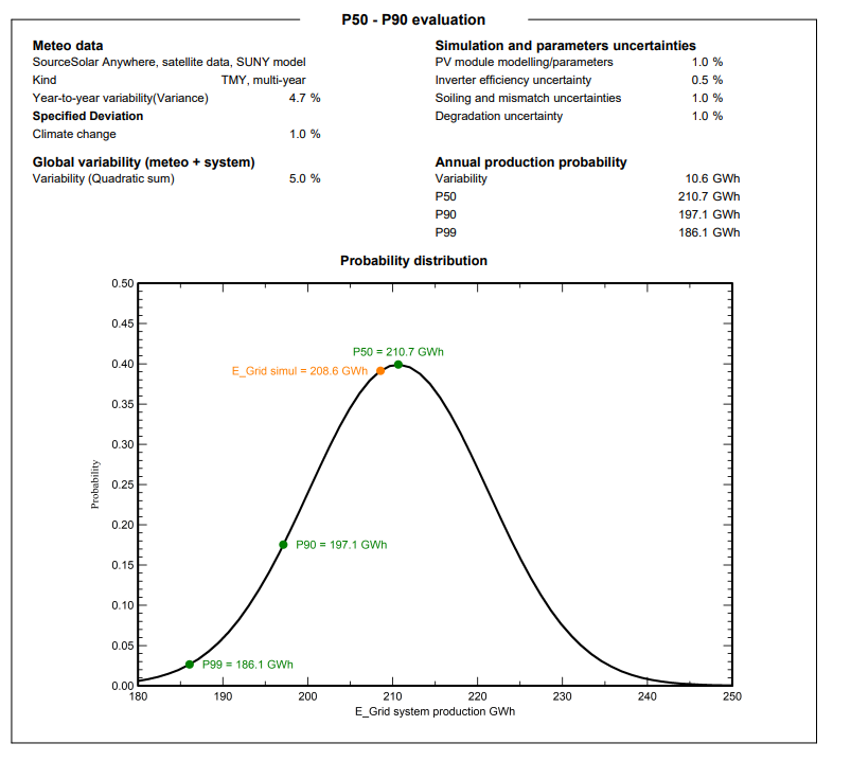
What could be the possible source of difference in P50 and E-Grid simul. here:
-
If EArray is effective energy at the output of array (and right before entering the inverter) Why the inverter loss over nominal inv. power should be applied on the DC side before entering the inverter?
-
Gain in Battery Energy (instead of loss) while Discharging
PVsystUser replied to PVsystUser's topic in Simulations
I sent the project! Thank you Andre! -
Gain in Battery Energy (instead of loss) while Discharging
PVsystUser replied to PVsystUser's topic in Simulations
-
Gain in Battery Energy (instead of loss) while Discharging
PVsystUser replied to PVsystUser's topic in Simulations
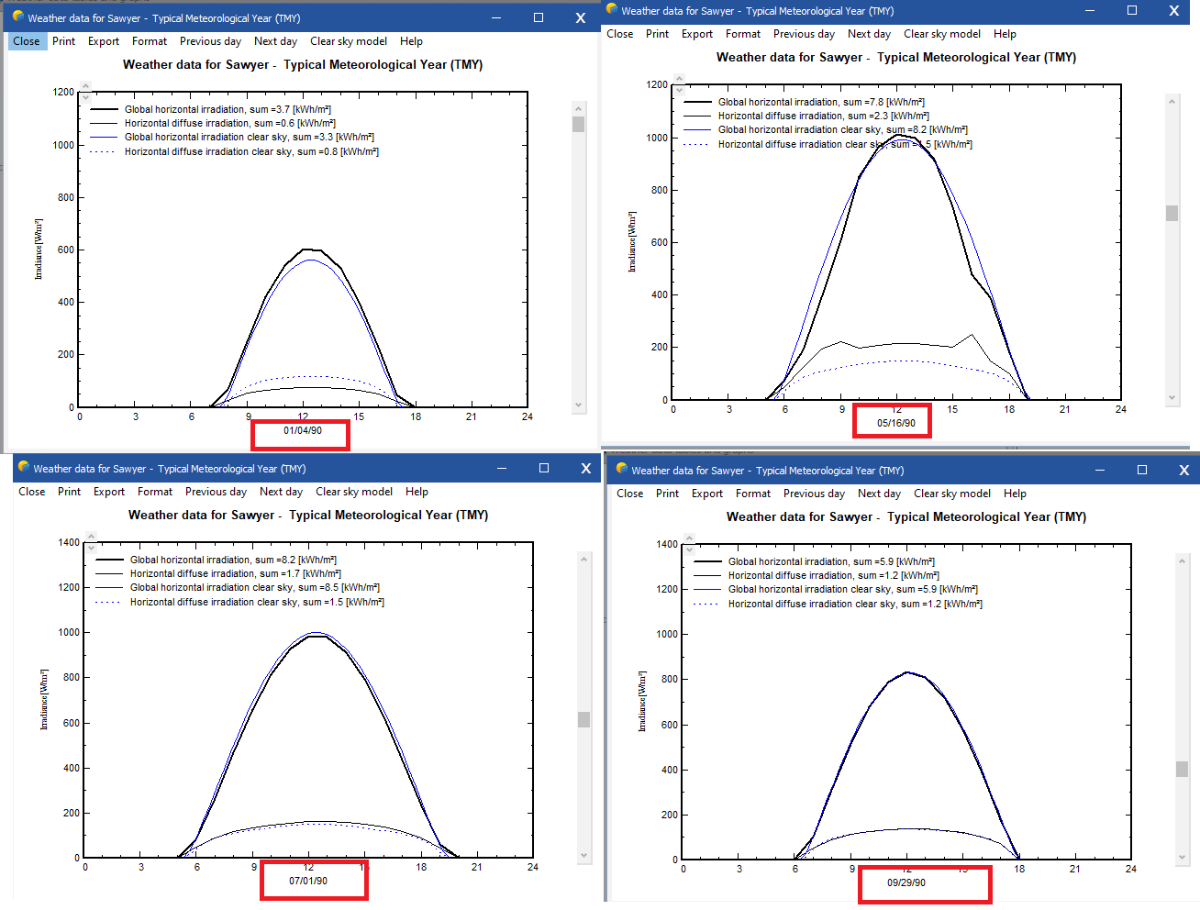
Thank you André! However I am a bit confused and your answer raised two more questions for me: Is there a place where we can define how the nominal power (PNom) of inverters is calculated? Is it the user that defines the clear sky model should be used? 2. In the quality check of my weather data there is no warning regarding clear sky model. Although the graph shows that there are months that my GHI is higher than clear sky model. Is the "Check data quality" enough for data quality check? (related screen shots below)
-
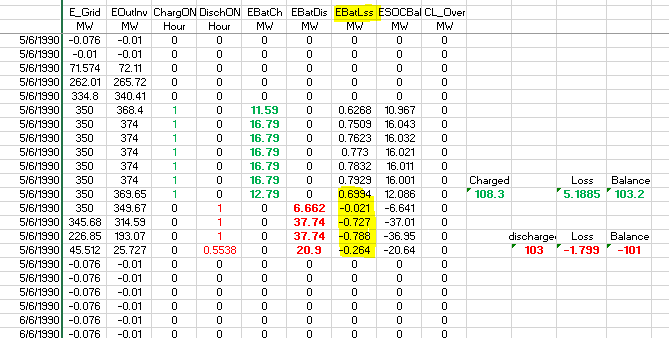
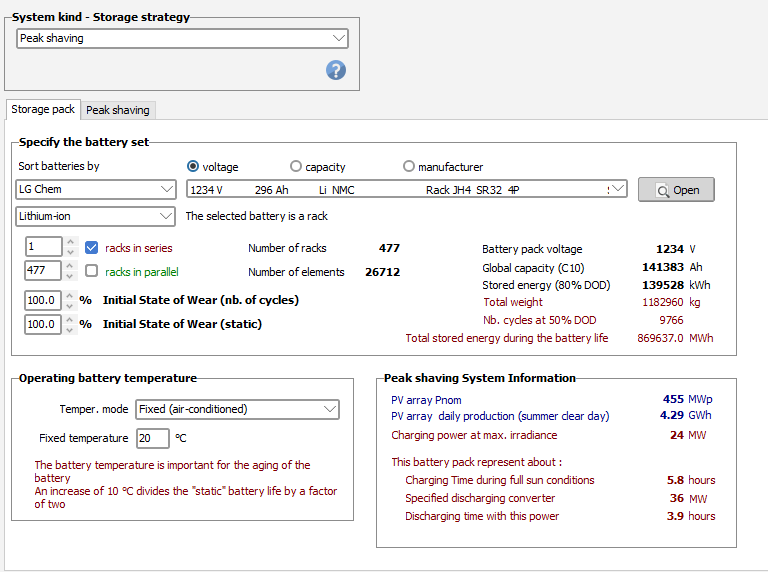
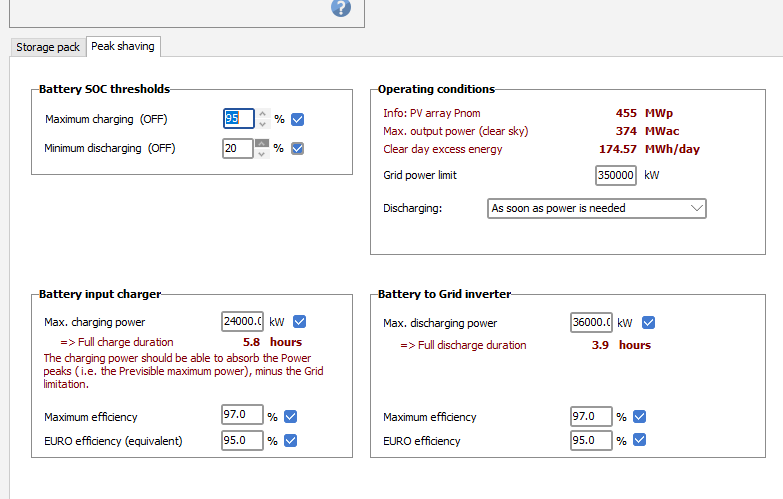
Hi, I have added storage to my PV system, the screen shot of storage windows are at the bottom of this message. Looking at 8760, there is a negative loss (or gain) while discharging, you can see it highlighted in yellow in the image below. This loss is added to the battery balance to get the discharged energy: EBatDis=EbatLss+SSOCBal What is the source of this negative loss or gain?
-
Thank you!
-
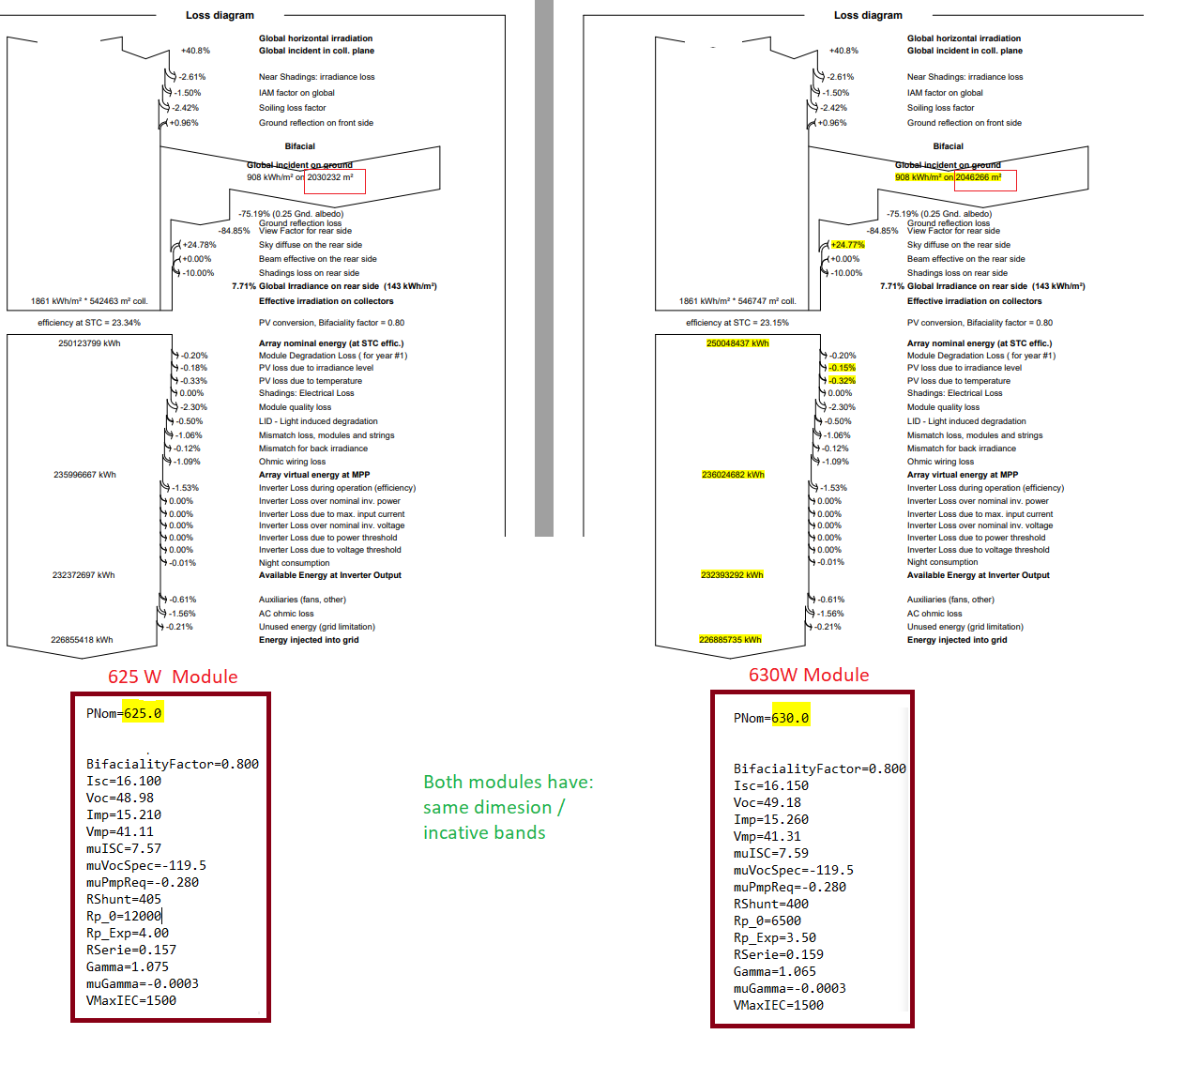
Below are the PVsyst results for two variants, with the only difference being the module wattage. The module dimensions and bifaciality are the same. I have included a few parameters below the PVsyst loss tree. Why has the global incident on the ground been calculated over two different square meters? Also, the sky diffuse values are different. Isn’t the sky diffuse on the rear side dependent only on the solar resource, environmental parameters like albedo, and the geometry of the system? Why do I see a difference here? All these small differences resulted in the 625W module performing better than the 630W module.
-
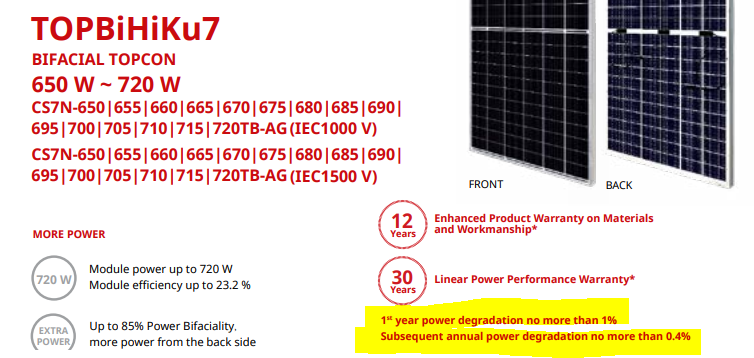
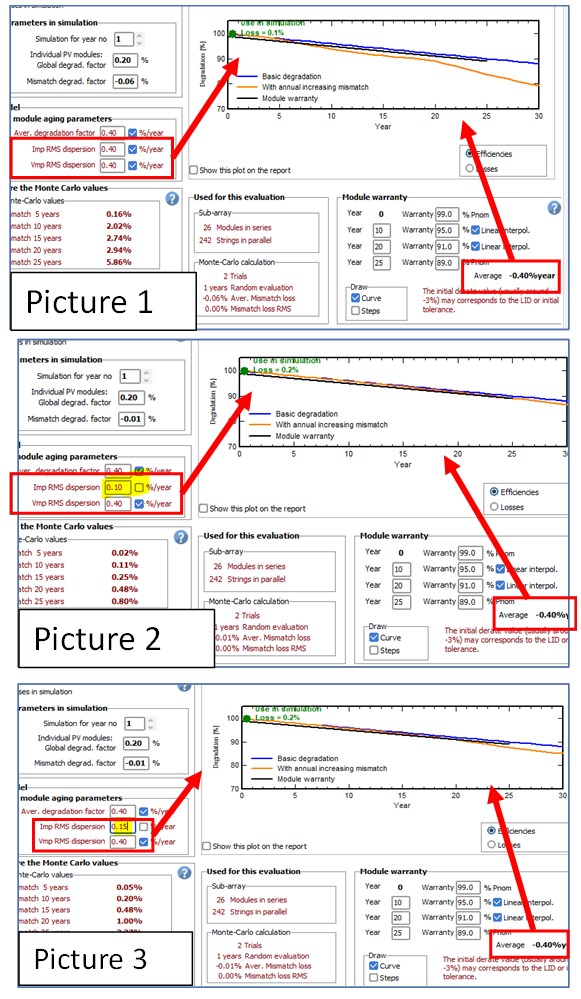
Hi PVsyst team, My question will follow these assumptions: Pvsyst forum suggests : The orange curve (sum of average degradation factor and mismatch increase due to degradation) should generally stay above the black curve (warranty), to be realistic. From <https://forum.pvsyst.com/topic/3450-degradation-factor-for-pv-module/#comment-9616> As far as I know, without further documentation, I would suggest using the default values. From <https://forum.pvsyst.com/topic/3424-imp-vmp-rms/#comment-9500> Pvsyst help: Now the warranty should normally apply to any module of the sample. Therefore if we assume that it is applicable to 95% of the modules, the sum "Degradation factor" + 2 * "RMS dispersion" should in principle not exceed the slope of 0.8% of the warranty. This is not the case in our example. My module datasheet warranty (highlighted below): Question : If I use the warranty numbers provided in the module warranty (shown above) and also use the default Imp and Vmp RMS values, the orange line does not remain above the black line (see picture 1 below). Is it a good practice to adjust the Imp RMS until the orange line stays above the black line? In pictures 2 and 3 below, I have changed the Imp RMS dispersion, and at 0.10% per year, the orange line stays above the black one. Is this a reliable procedure to determine the Imp and Vmp RMS dispersion for my simulation?