Hello Friends!
I am working on PVsyst report comparison as above subject, the project size is around 180MWac. The site is in Australia.
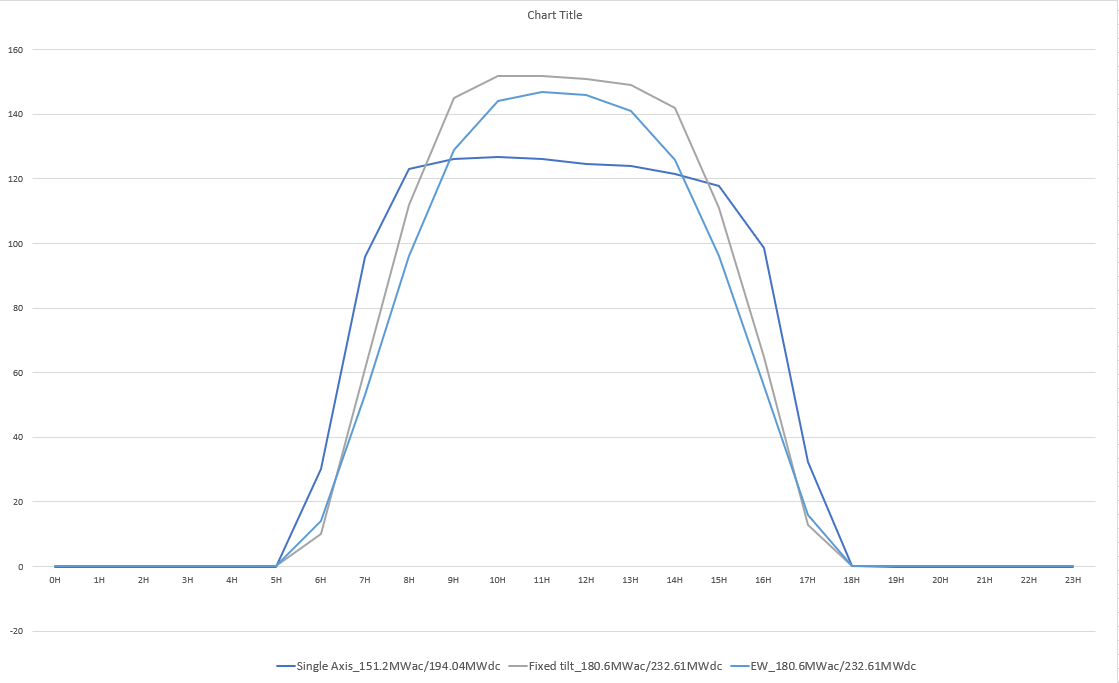
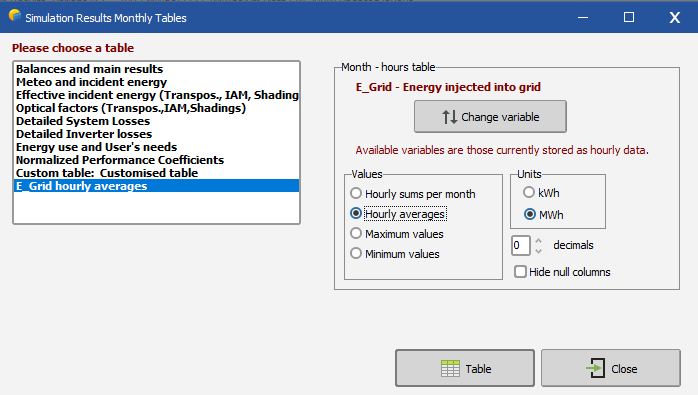
I copied "E_Grid hourly average" (refer capture 1) data for all above options to show their Yearly values in curve for comparison.
Please refer capture 2, the east west curve is not in share similar to single axis tracker in contractor it is within the curve of fixed tile simulation of same size.
In short, I wonder why east west curve (10 Deg East west) remain within the Fixed tile (20 Deg) however it should be bit wider like single axis tracker.
For info,
I used dome for the east west and mixed orientation with each inverter have 50-50% mixed orientation strings.
Please let me know if you need more info.