


Abid Ali
-
Posts
16 -
Joined
-
Last visited
Posts posted by Abid Ali
-
-

I need to investigate hourly PV module output current and voltage for different tilt.
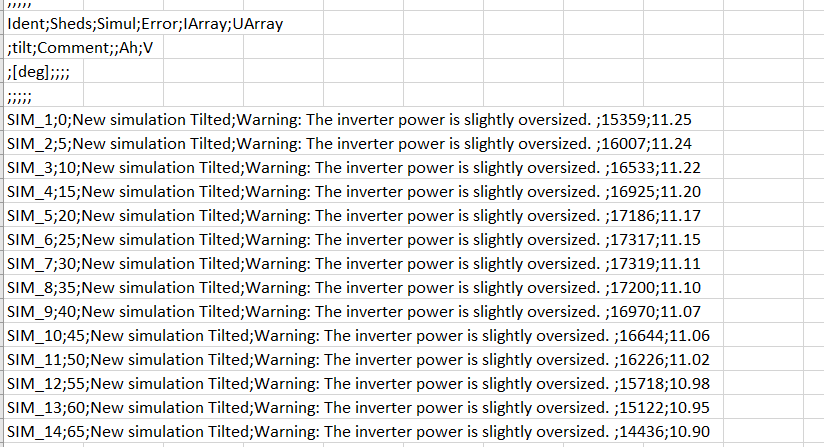
For example when I run batch simulation using tilt= 0 to 65 degrees, PV output current is summed in AH for each tilt case.
How to get time series hourly PV ouput for each tilt separately? i.e average current in A instead of summed in Ah
-
Great, many thanks. I highly appreciate you for the swift response and help
-
Thanks. Which option I should use to get yearly simulation?
Can I do this without using a load? Just through selecting a PV modules and a location?
-
Hello,
Are am working on a research project to get a constant current from a PV module through adjusting tilt.
Can I do it using PVsyst to get the expected hourly tilt values (for example for one day for for a specific location) before designing a experimental setup?
Thanks
-
9 hours ago, dtarin said:
Tilt and orientation will vary the current mostly as this changes amount of irradiance received. Temperature will affect the voltage more; irradiance, not so much.
Thanks. I understand and totally agree to this theoretically.
However, I was wondering if PVsyst is equiped with some formulas for Voc that can tell the impact of facing of PV cell/module away from sun's position
-
6 minutes ago, Abid Ali said:
Hello,
I am working on a research project to electrify a DC load with the direct supply from PV module(s) (without MPPT, battery storage or any power electronics). The objective is to investigate the performance of DC load under different voltages. Therefore, I want to adjust the PV module voltages through adjusting the tilt and orientation.
I was wondering if there exists any tool/function in PVsyst where I can set the location, select a date, choose a PV module and check modules's hourly open circuit voltages for a particular user-set tilt/orientation setting.
I hope my question is clear. However, if you need more clarification, please write me here. Thanks in advance
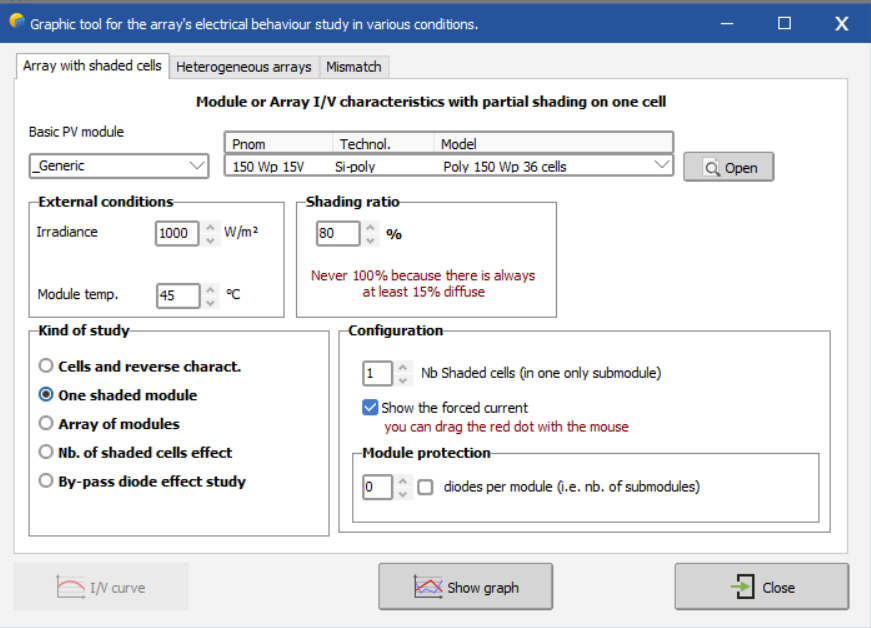
There is a graphic tool for the array's electrical behaviour (please refer to image). I am unable to see tilt/orientation option here

-
Hello,
I am working on a research project to electrify a DC load with the direct supply from PV module(s) (without MPPT, battery storage or any power electronics). The objective is to investigate the performance of DC load under different voltages. Therefore, I want to adjust the PV module voltages through adjusting the tilt and orientation.
I was wondering if there exists any tool/function in PVsyst where I can set the location, select a date, choose a PV module and check modules's hourly open circuit voltages for a particular user-set tilt/orientation setting.
I hope my question is clear. However, if you need more clarification, please write me here. Thanks in advance
-
Thanks for the reply.
We hope to get the Aging AND Carbon Balance Tool for the stand alone systems in the upcoming release.
-
On 4/26/2022 at 9:39 AM, Michele Oliosi said:
Hi,
You should consider using the "Aging tool" that you will find in the advanced simulation window.
This will take into account the yearly degradation, basically what you have done in excel. It also allows to access to the degradation loss window, which will give you more information on the aging loss.Note that you can only simulate a single year with the meteonorm data you have, because what meteonorm provides (in PVsyst) is a statistics-based synthetic year, similar to a typical year, that is not a real year per se. This is indicated by the year 1990 in PVsyst.
You can simulate the aging through 20 years of simulations using the meteonorm data, but the same weather data will be used every year, which is not really realistic. Real years will be subject to year-to-year variations. Therefore you should maybe look into getting real time-series data for 20 years. One option (though it may have only 12 years or so) is:
Main window > Databases > Known format : choose "PVGISv5 hourly time series direct import" in the drop down menu. This will download a number of time-series files, which you can then use in the aging tool above.
NB: the aging tool is not available for stand-alone systems yet. In order to use it you should redesign your system as a grid connected one. However please first consider the stand-alone system to get advanced information on the battery sizing.
Hi,
Thanks for the detailed information, greatly appreciated
We have been following the same procedure through using the grid connected one. You reply and suggestion have validated our approach so that now we can work with more confidence onward.
Have a nice day!
-
5 hours ago, Lazare Fesnien said:
Hi,
Are you on grid connected system ?
This isn't normal, did you run the simulation correctly ?
Hi,
No, as I mentioned above, I am working for Stand-alone PV systems.
-
Thanks Lazare.
I also noticed Aging option is disabled in Advance Simulation. I intend to calculate the yields for 20 years.
Can you please suggest on this?
-
29 minutes ago, Abid Ali said:
Hello
I am using a licensed version of PVsyst, updated to version 7.2.14 (r25623).
I am unable to find Carbon Balance Tool in PVsyst. Could you please suggest me where should I get this option?
Best regards
I am working for Standalone PV systems
-
Hello
I am using a licensed version of PVsyst, updated to version 7.2.14 (r25623).
I am unable to find Carbon Balance Tool in PVsyst. Could you please suggest me where should I get this option?
Best regards
-
1 hour ago, Abid Ali said:
Hello Good Day!
I am working for an off-grid solar PV project in MALI. The project is about electrification of health centres, which may contain some critical health related equipment. Therefore, information about yields and PLOL for each year would be very useful.
I was trying to simulate our PV system using a licensed PVsyst to estimate the results for 20 years . I was trying to do it using Advance Simulation. However, simulation date available at this option are only for 1 year starting from 1990-01-01 to 1990-01-01. The Meteo File for this location shows Meteonorm (19986 - 2005), sat=100%, Synthetic. Therefore, I am able to simulate the results for 1 year. For the remaining years, I am calculating yields manually using MS Excel file by applying 0.5% degradation rate for PV madules.
I was just wondering if I am making any mistake here. Could someone guide me to use proper options in PVsyst in order to perform the simulations for 20 years.
Corrections:
1 year starting from 1990-01-01 to 1990-12-31.
Meteonorm (1986 - 2005)
-
Hello Good Day!
I am working for an off-grid solar PV project in MALI. The project is about electrification of health centres, which may contain some critical health related equipment. Therefore, information about yields and PLOL for each year would be very useful.
I was trying to simulate our PV system using a licensed PVsyst to estimate the results for 20 years . I was trying to do it using Advance Simulation. However, simulation date available at this option are only for 1 year starting from 1990-01-01 to 1990-01-01. The Meteo File for this location shows Meteonorm (19986 - 2005), sat=100%, Synthetic. Therefore, I am able to simulate the results for 1 year. For the remaining years, I am calculating yields manually using MS Excel file by applying 0.5% degradation rate for PV madules.
I was just wondering if I am making any mistake here. Could someone guide me to use proper options in PVsyst in order to perform the simulations for 20 years.
Hourly optimal tilt to keep a constant current from a PV module
in How-to
Posted
I got my answer through following this. Thanks