Rafael Santos
-
Posts
24 -
Joined
-
Last visited
Everything posted by Rafael Santos
-
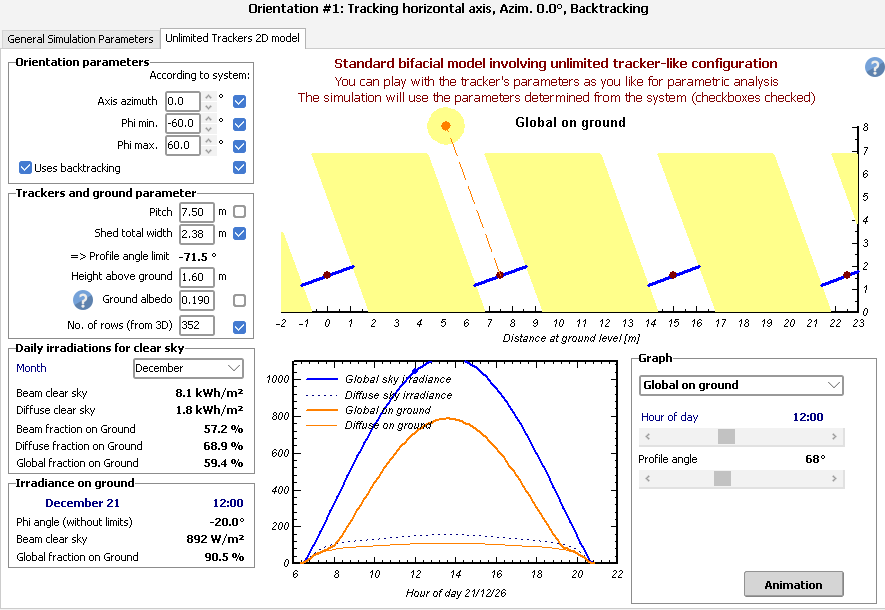
Yes, I used trackers, with backtracking (same as the actual system):

-
Continuing the question: I am thinking about 1 - ignoring this shape difference and count it as uncertainty, or 2 - Consider the module as monofacial, and "boost" GPOA values with the mantioned formula: E_Total = E_POA + E_Rear * 𝜑 or E_rear = RPOA * (1 - "Structural shading factor") The second option makes sense? If so, which formula would be more accurate? Thanks! Rafael
-
That's a very interesting topic! I am also carrying out a performance analysis, with RPOA measurement... Since it is not possible to use it on the .MET file (like GPOA), I am trying to fit the bifacial parameters (structure shading + transparent fraction) running multiple simulations and comparing the results (GlobBak) to the measured GPOA, to see which one fits best. Apart from the absolute values, all simulations showed the shape curve similar to GHI, while the measured curve showed a shape similar do GPOA: Is this have something to do with the assumption that the re-emitted irradiance is isotropic? This text below was taken from PVsyst help: Or am I doing something incorrect? Maybe "Globak" is not the right variable to compare with RPOA? Even so, would the shape of the curves would be that different? Best regards, Rafael
-
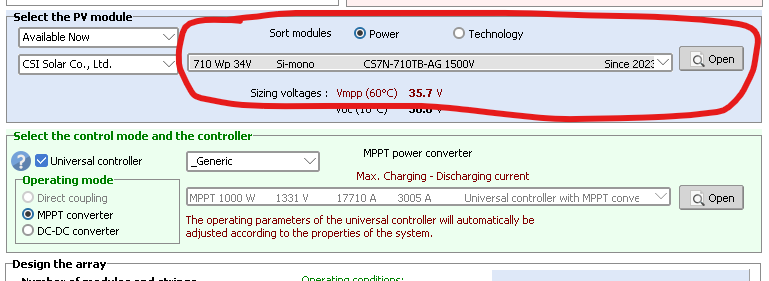
Hi, I am trying to run a stand alone project, but when I choose a bifacial module, the bifacial feature does not seem to show... Isn't it possible to simulate bifacial modules in stand alone projects? If it is not possible, is there a workaround to this? Beste regards, Rafael
-
Degradation in the First Year with LID losses
Rafael Santos replied to Tanatip's topic in Simulations
Hi, Normally what I do in this case is to use LID=0,6% (wich is 1% warranted at the end of the first year - 0,4% degradation at the end of the year). -
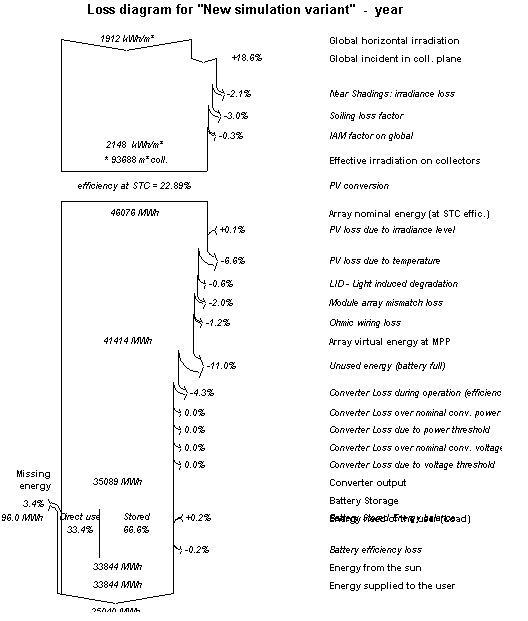
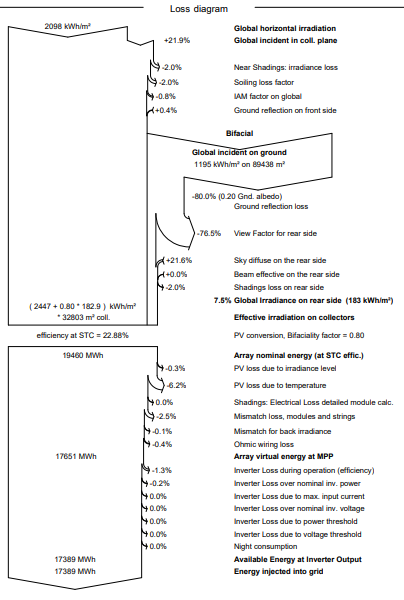
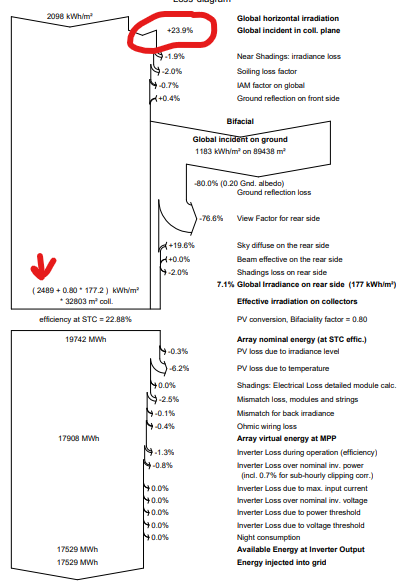
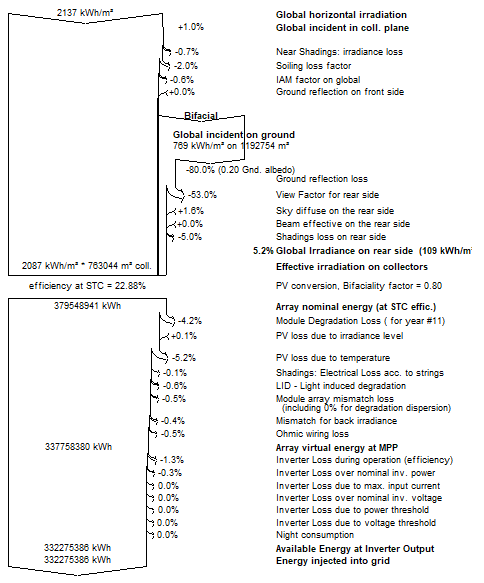
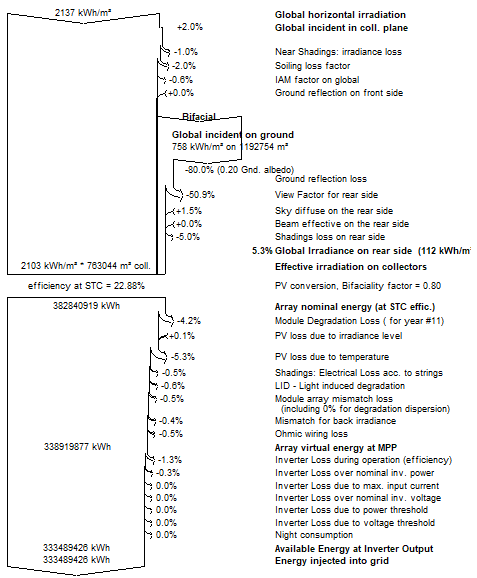
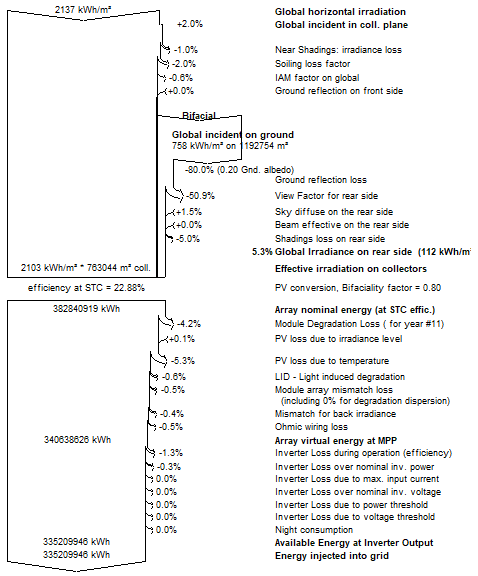
Hi! I am currently working on a project with 1-year on site measurements, with 10 minute temporal resolution. I want to predict the annual energy production (using TMY), but the data from TMY is hourly based. I thought at first of simulating with 3 MET inputs: 1-year measurement (hourly), 1-year measurement (10-minutes), and TMY (hourly), and then apply the correction: SIM_TMY_corrected = (SIM_10-min_meas / SIM_hourly_meas) * SIM_TMY_hourly I thought this would have been a fair approximation, as the sub-hourly simulation would only have an effect on the clipping losses. But as I made the simulations, I noticed that the sub-hourly simulation has a very large effect also on the transposition gain, as showed below: Hourly measurements: 10-Minute measurements: With that being said, ,y question is: would still make sense to apply the correction above? In this particular case: CF = 17529 MWh / 17389 MWh Best regards, Rafael
-
Increase in energy yield with azimuth different than zero
Rafael Santos replied to Rafael Santos's topic in Simulations
I just uploaded a .MET file containing clear sky radiation data instead of regular GHI, and ran a batch simulation changing azimuth angles, and the optimal azimuth angle was 0deg N, as expected! So, the "problem" here is specifically the TMY. Altough at "normal" conditions (considering only the universe geometry) the optimal azimuth should be zero, some sites have specific climatology (tend to be cloudier at mornings or afternoons on certain months), and this may affect the optimal annual energy production, specially considering fixed-tilt modules. -
Increase in energy yield with azimuth different than zero
Rafael Santos replied to Rafael Santos's topic in Simulations
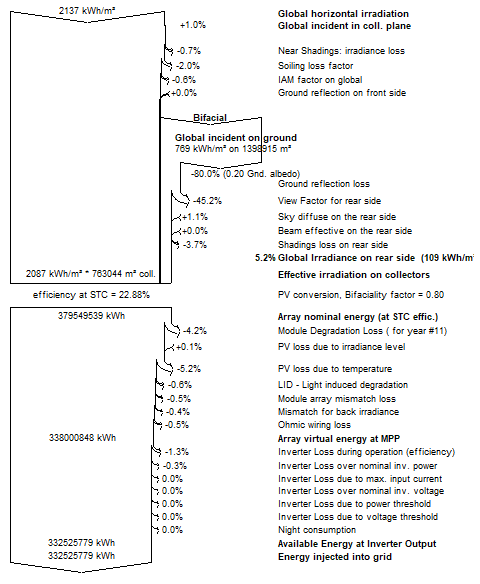
Thanks for the reply! I performed another simulation with electrical shading losses (acc. to module strings, 100% fraction for electrical effect). Although the results are slightly different, the question remais, as I am still getting higher results for a 40° azimuth: Azimuth: 0° Azimuth: 40° The main concern here is not the shading or any other losses, but the second line: "Global incident on coll. plane". This gain should be higher for a 0° azimuth. Best regards, Rafael
-
Hi, I performed simulations with different azimuth angles (-10 to 90 degrees, in 5-degrees steps) and surprisingly I got higher annual energy production with most of the azimuth angles that are different than zero (the project is located on the southern hemisphere). Simulation with Azimuth=0°: Simulation with Azimuth=40°: Intuitively, I would think a 0° azimuth would always give me the higher energy yield, which apparently is not so... Of course, the configuration is exactly the same, except for the azimuth. The modules are fixed, tilted 12°, and bifacial. Best regards, Rafael
-
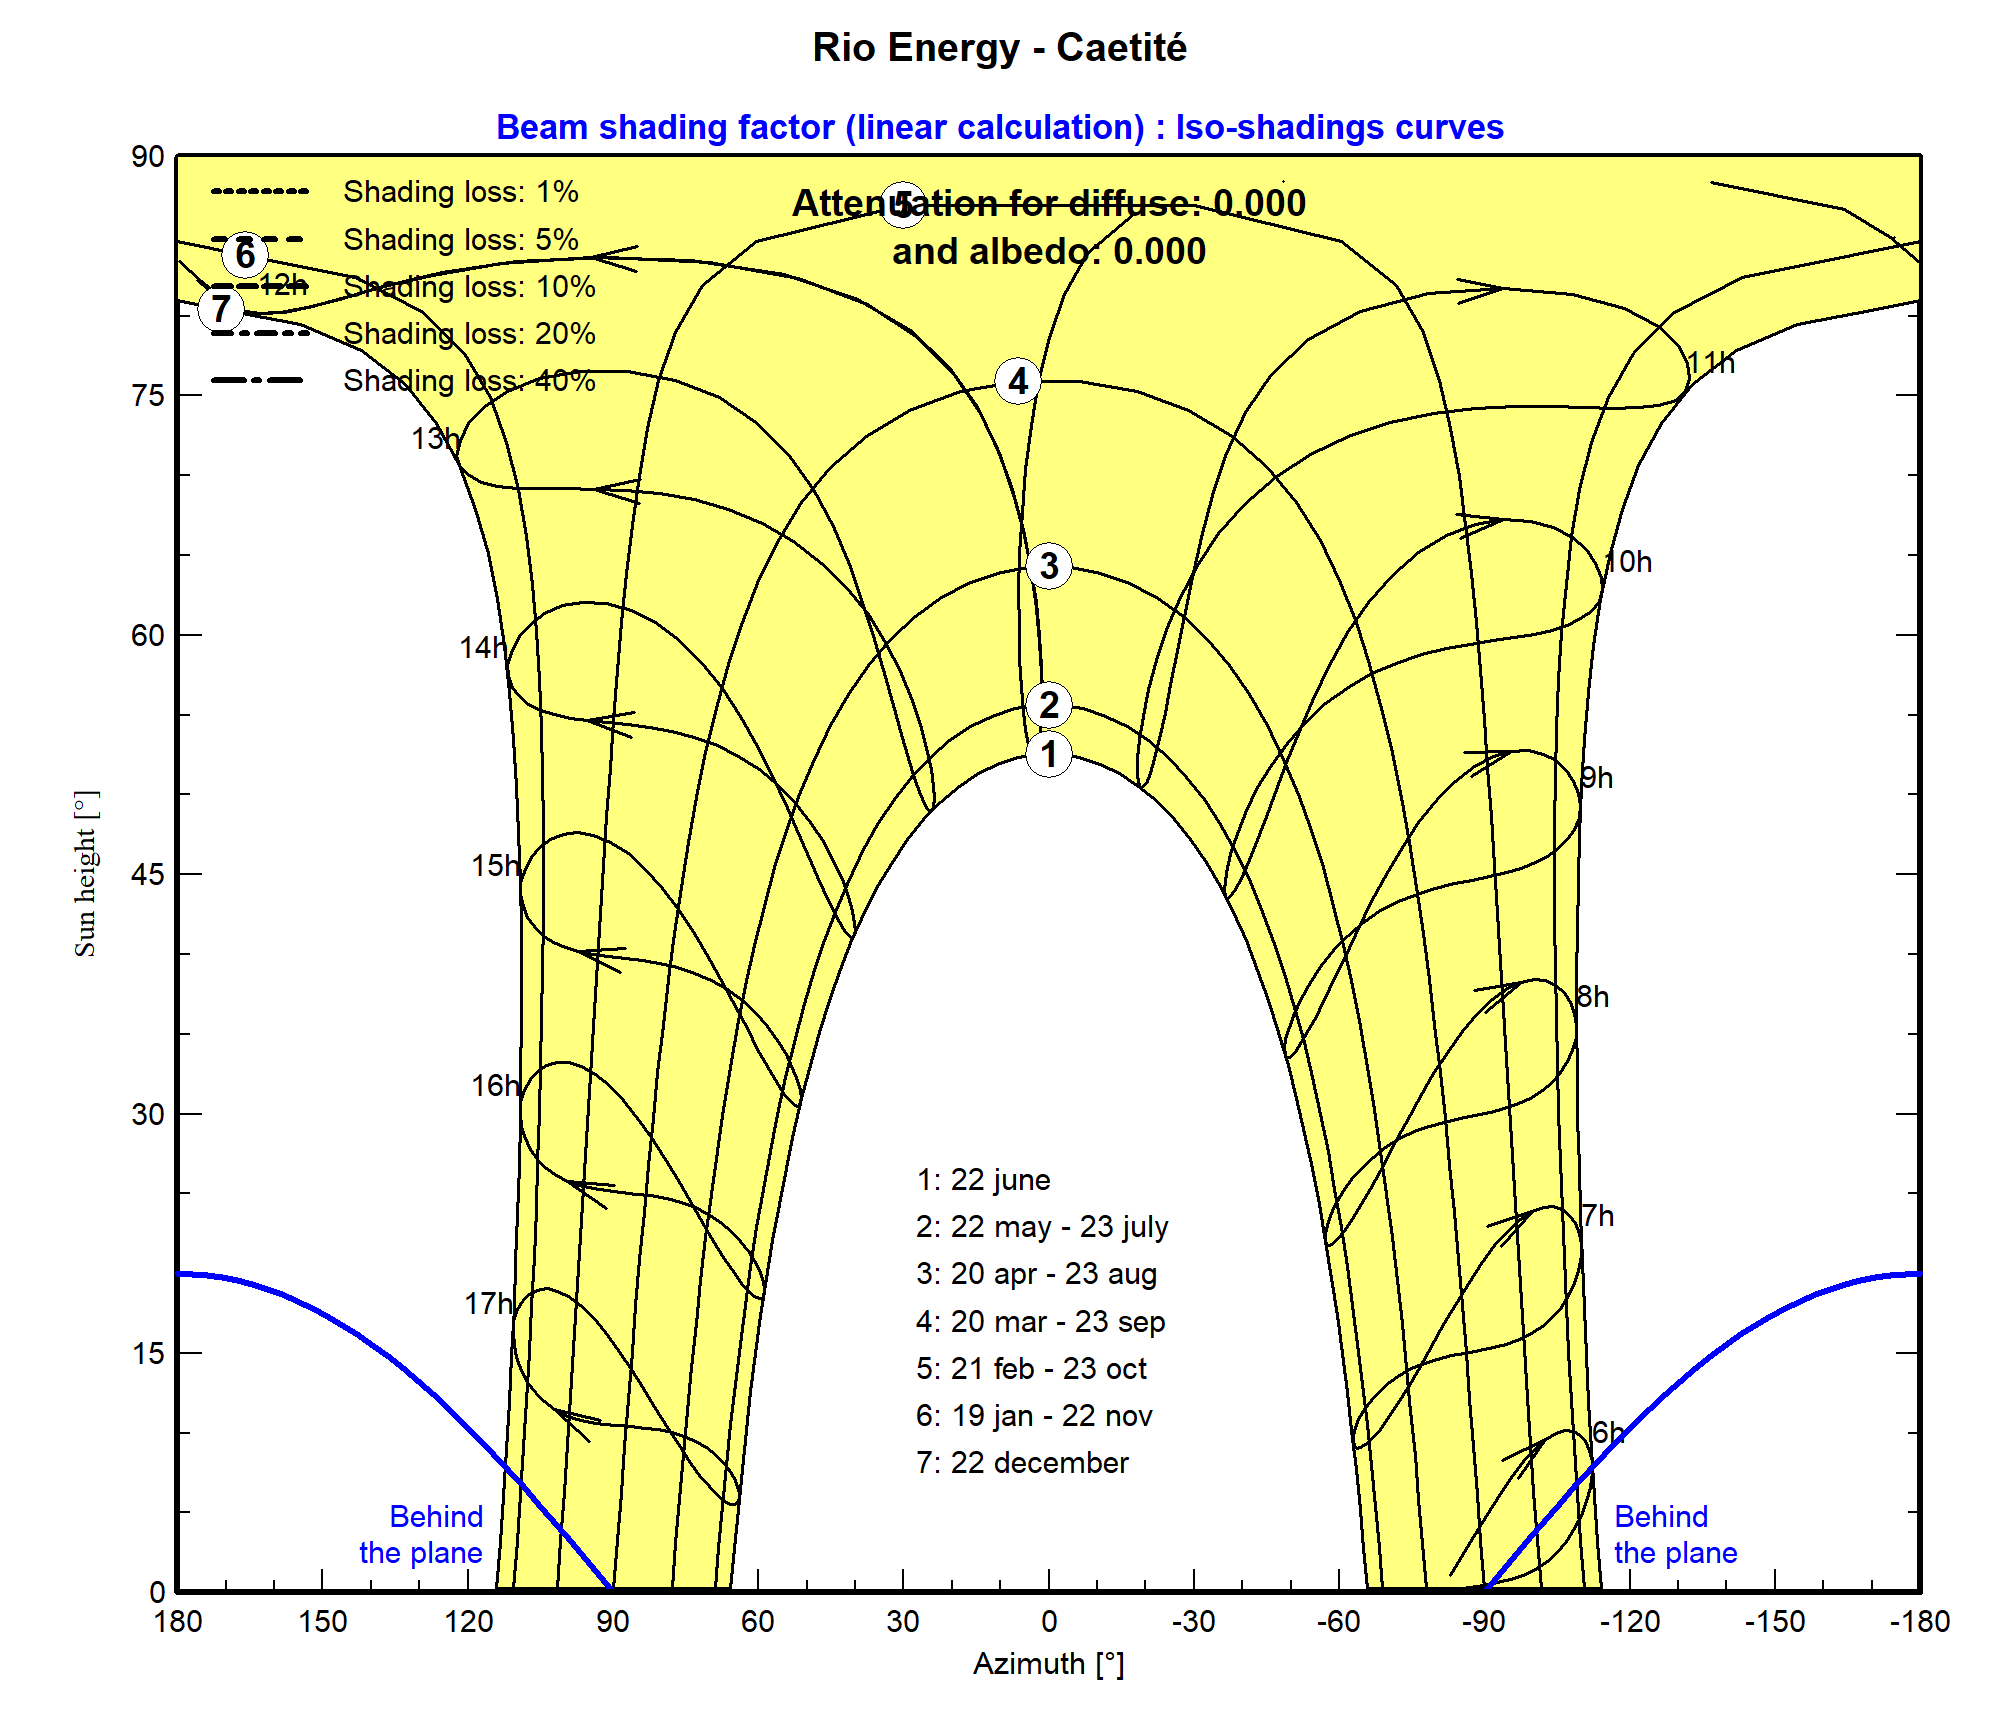
Hi, Since I updated to version 7.2.3 the iso-shadings curves is showing the "behind the plane" blue line. I thought this was only for fixed planes, but I am using trackers with backtracking (see picture attached). Is this a bug or did I misundertand something? Best regards, Rafael
-
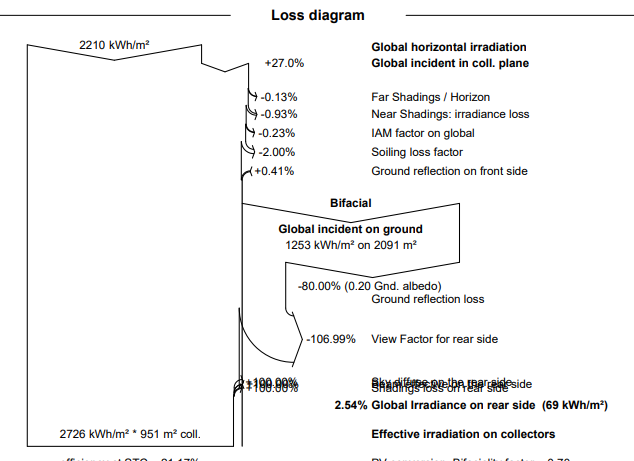
Hi, I upgraded to version 7,2 and found problems simulating with bifacial modules. I am having a few unrealistic values (e.g. View factor of more than 100%), I attached a image of the loss diagram. Finally, I downgraded to the previous version (7.1.8) and the results were fine!
-
Bi-facial Modules - View Factor for Rear Side
Rafael Santos replied to Rafael Santos's topic in Simulations
Updating: I did some reverse engineering, and found that with the loss value of 115.95 kWh/m² (36.36%) everything work fine, including all the other losses! Maybe there is something wrong with the values on the "View Factor for Rear Side" losses presented on the table? Regards, Rafael -
Growth of mismatch is also included! =)
-
Regarding the RMS dispersion values, this is strange, because I allways set them zero and it works just fine...
-
Hi, By default, PVsyst considers the average degradation loss throught the whole year. So, if you put degradation loss of 0,4%/year, for year 1, it will consider degratadion losses of 0,2% (starting the year with no degradation losses at all, since the modules are brand new, and ending the year with 0,4% losses, thus averaging 0,2%). Year 0 means it will not consider any degradation losses. So if want to make a batch simulation for eg. 10 years and you use 1 to 10, PVsyst will consider the average losses throught each year. If you want to change for the losses in the beggining of each year, you should use 0 to 9. Best regards, Rafael
-
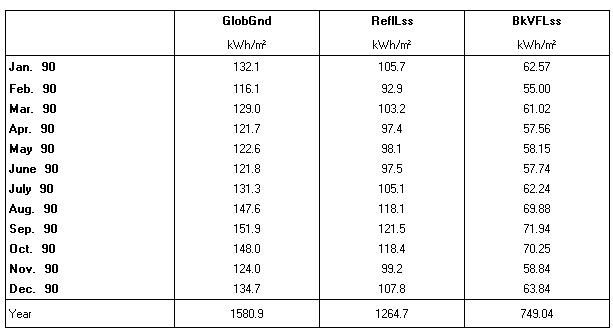
Hi, I recentrly ran a simulation using a bi-facial module, and I was trying to understand better the physics and results of it. I came across a loss value of -78,82% for the parameter "View Factor for Rear Side" as shown in the loss diagram attached. My question is how It came to this number, since my absolute results were: - Global incident on ground: 1581 kWh/m²; - Ground reflexion loss: 1265 kWh/m² (this value is ok, 80% loss due to an albedo of 0.2); - View Factor for the rear side: 749 kWh/m² (this is strange, because I understand it is supposed to be (1581-1265)*0.7882) Is it something I am doing wrong? Best regards, Rafael Loss Results Loss Diagram
-
Here's a solution that fitted me! It gives slightly different results, but almost the same! ;) Before a perform a simulation, I go to the "degradation losses" section and take note of all degradation and mismatch values for a given time horizon (in my case, 20 years), in a Excel spreadsheet. Then I untick the option to use degradation in the simulation. Then I go to the batch simulation and change the variables "module quality" and "mismatch", and paste the values given in the spreadsheet. But one should never forget the initial values (eg. if I use module quality -0.4% and mismatch 1%, these values have to be added every year)! I don't know if I was clear enough, but if anyone have a question, feel free to ask! Regards, Rafael
-
Optimization Tool - Pitch Does Not Work For Tracking Systems
Rafael Santos replied to Rafael Santos's topic in Simulations
Sorry, I couldn't understand your question... I allways use backtracking in my simulations. Maybe you've got a point, since the optimization tool seems to work allright with fixed modules, but I didn't understand exactly what you meant. Could you please explain? Thank you very much for the help! -Rafael -
Hi all! The "optimization tool" option could be a very interesting tool to find an "optimal" pitch for a given project, but it does not seem to work with tracking systems when I change the pitch parameter, I don't know if I'm doing something wrong or if it's a bug. It gives always the same system production. Someone had the same problem, but he/she commented on somebody else's topic... I think it is a good idea to open a separate topic about it. And just to be clear, I tried a lot of different pitch values, from very close to far, so It is not that the pitch values are already too high! ;) Regards, Rafael
-
Totally agree! I was about to make the same suggestion... I have to estimate the system production over 20 years, and sometimes 2 or 3 different configurations, so I have to run 60 times and save 60 different files, with every loss number on them. And if by chance I notice that I made any mistake, I have to start from zero, it's a torture! :mrgreen:
-
Hi Mermoud, I imported a TMY from an hourly-based ascii file. The file contains only global horizontal irradiance and temperature values. When I checked the quality of the data, PVsyst said it seems to be ok, although it suggested me a time shift of 13 minutes (no logycal reason for that, since my data is hourly-based). My dataset has timestamps indicating the beggining of the dataset, the same way PVsyst works (I suppose), so I guess this is not the problem here. Somehow I am getting very high values of Normal Beam Irradiance (close to 1400 W/m²) at the beginning of the days in some days of January, March, April, October and November. I attatched a print of January 24th, as an example. (GlobHor in yellow, DiffHor in red, BeamHor in black and BeamNor in blue). I am pretty sure this is the reason why I am having big shading losses, as I am using tracker, and the beginning/end of the day has most losses. Thanks for the attention, and regards, Rafael
-
Hi, I ran a simulation on a site for a 1MWp project, and I found 1.9% for PV loss due to irradiance level. I was using PVsyst v.6.25 at that time (July, 3rd). Today I ran the same project with PVsyst 6.3 (the new version) and I got 0.6% loss for the same parameter. I haven't change anything on the meteo parameters, so I was curious to know how come the results be so different? I took a look at the software development at the web site, and I noticed that the following upgrade in version 6.27: "PV module Rserie default value: according to 200 W/m2 relative efficiency (-3%)." I know that Rseries and Rshunt parameters affect this kind of loss, so is it possible that this could be the answer? PS: I noticed the same situation for the temperature loss - but to a less extent (9.4% on the previous version to 8.8% on the new version). Thank you so much for the help, and best regards, Rafael Pereira Santos
-
Dear all, does anybody know how exactly does PVsyst handle the overpower in the inverter due to oversizing of the PV Arrays? Does the inverter limit the power by increasing the voltage (thus decreasing the current), resulting in a loss of eficiency (inverter operating outside the MPP), or the inverter allows an overcharge (let's say, 5% or something around it)? In a real system, does the power will allways be limited by the inverter or sometimes it delivers a little bit more (inverter able to handle an overcharge)? If it does, is PVsyst able to account for it or it simply ignores it? Thank you very much, and best regards, Rafael
-
Hi, I am a new PVsyst user as I used to only design wind energy projects. I have 1 year worth of data (global horizontal irradiation, temperature, wind speed and direction) measured on site. Which is the best source of meteo data? The long therm ones that come in PVsyst (NASA, Meteonorm) or my own measurements? Also, is it possible to correlate my short therm measurements with the satellite data? If I do this, would there result in a significant reduction in uncertainty? Lastly, are there any open source of hourly radiation data, (like MERA and reanalysis in wind)? Best regards, Rafael