Emkey
-
Posts
7 -
Joined
-
Last visited
Everything posted by Emkey
-
Dear, Would it be possible to delete the special graphs in our default report printing? This issue has been going on for a year now, it would be nice to stop deleting this page at every simulation. Thank you,
-
Dear, Just saw your post, thought I could help you out. The azimuth corresponds to the orientation of your system compared to the south (in the northern hemisphere) thus: 90° azimuth will correspond to a system facing the west -90° azimuth will correspond to a system facing the east This parameter will correspond to the orientation of your roof. As for the tilt, you should choose the configuration that optimise your production during the periods of consumptions. If your house is occupied exclusively during the winter, you should choose a higher tilt, while in a case of a house occupied only during the summer, the tilt should be lower. Hope this can help you. Marco
-
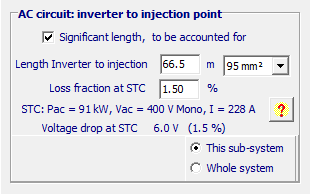
Good morning, I have a problem in the section concerning the AC losses between inverter and injection. The current shown in this section does not correspond to the DC Current not to the AC current delivered by the inverter (DC Current around 133.98 A, Ac Current around 133.8 A). To what does the current in this section correspond? Thanking you in advance, Marco Cappa

-
I completely agree, in our case we do not use those graphs and we would like to remove them by default. Thank you
-
Same problem, some months after the topic was posted. Any update?
-
Hello, I know the tiltle sound pretty strange, but I'll try to explain myself in the best way possible. We received a simulation from one of our clients which used a configuration (I will call this configuration A) which is as follows: Tracking two-axis, frame E-W: Frame min tilt=0°,Frame max tilt=0°, Axis perp Azimuth=0° We developed an identical configuration with a 1-axis tracker (I will call this configuration B): Tracking Plane, tilted axis: Axis tilt=0°, Axis Azimuth=0° Basically, configuration B usess a 2-axis tracker as a 1-axis tracker. Now, except for the difference in the computational time (much longer with configuration A), we unexpectedly found a great difference in the annual production (much higher in configuration A), which is given by a "near shading loss" of -2.5%, which concerns only the configuration B. Could you help me understanding why do we have a different loss when all the other parameters are the same? I attached a copy of the tracker used in the configuration A, if this helps understanding what I explained above. Thank you very much, Marco
-
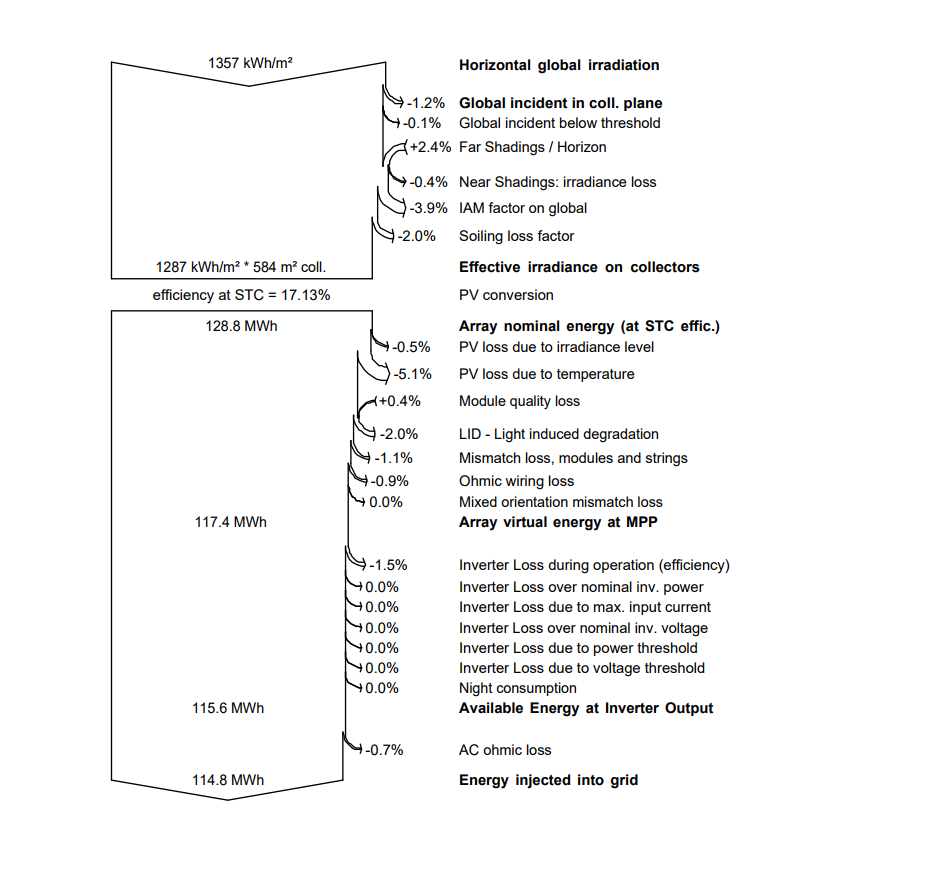
Hello, I just completed a simulation which returns me with a positive loss for the far shadings (see first image attached). When I remove the horizon scene, the positive value is given for the near shadings (see second image attached). The system has a NO/SE balanced configuration. What could cause this problem?