All Activity
- Past hour
-

about PV module ageing parameters : Imp/Vmp contributions
André Mermoud replied to Chen's topic in Problems / Bugs
You can find some data about the current and voltage degradation in the works, namely, of the TISO in Switzerland. For example in this publication: https://www.researchgate.net/publication/256080133_TISO_10_kW_30_years_experience_with_a_PV_plant - Today
-
It is correct, that PVsyst uses the Erbs correlation for the case that only GlobHor (GHI) is given, and the diffuse contribution needs to be derived from a model. The report does not seem to reflect this properly. A ticket has been created to fix the problem in one of the next PVsyst releases. Thank you for reporting the issue.
-
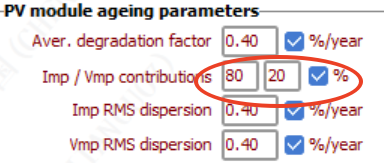
We obviously don't avail of detailed ageing data for a specified PV module. The average degradation rate itself is really not well defined. In the literature you can find a wide panel of values (0.3% to 1%/year). The PVsyst proposition of 0.4% seems a reasonable choice for usual modules. The specific mismatch effect due to ageing has been developed "theoretically" as a tool in PVsyst, without any experimental basis. We don't know any publication studying this problem in the literature. The hypotheses under this evaluation (Monte Carlo evaluation of the dispersion progress) are purely speculative. Therefore this model is obviously not able to take your particularity into account in a reliable way. You can probably take a lower value for the Isc/Vos RMS.
-
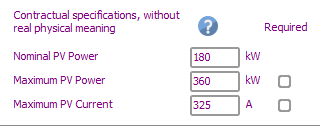
The PVsyst proposition doesn't take the maximum current into account. It is your job to check it in your final design. However the maximum current of a PV array is not well defined: the value corresponds to the STC (1000 W/m2), but if the inverter is specified for a given maximum current, it will limit the array current during operation, by displacing the operating point on the I/V curve. By the I don't see where you find that maximum current of 180 A. The manufacturer specifies 325 A in the PVsyst database: Your configuration of 15 strings of 25 modules of 650 Wp represents a PV power = 243 kW, i.e. a current of 238 A under 1020 V at STC.

-
Hi, There isn’t a dedicated “handrail” object for roof safety in Near Shadings. While Simple and Double crossbar railings exist as Elementary shading objects, the most reliable way to add a continuous 1 m guardrail around each zone is to model it with parallelepiped objects and place them along the zone edges. In your scene, go to Create → Elementary shading object and choose Parallelepiped. Set the dimensions, for example: Height: 1.00 m, Width (thickness): 0.10 m (or match your actual fence width), Length: as needed for each edge. Place the object along a zone edge, then copy and paste it to cover the entire perimeter. Rotate (using rotate tool in the Modify section) as needed to align with each side. If your project specifically uses a crossbar-style railing, you can also try the Simple or Double crossbar elementary objects instead of parallelepipeds.
-
Hi. How can I add a jea roof safety of 1 meter on each side of zones in Near Shadings?
- Yesterday
-
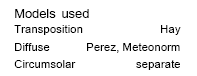
When i provide GHI as input but not DHI (so PVsyst has to calculate DHI), why does the PVsyst output report say "Diffuse: Perez, Meteonorm" under "Models used" when the PVsyst advice on this is that the Erbs model is used and Perez is not currently implemented? https://www.pvsyst.com/help/physical-models-used/irradiation-models/diffuse-irradiance-model.html TIA
-
 Farkhi joined the community
 - Last week
-
 electricbike484 joined the community
 -
 MBU_3E joined the community
 -
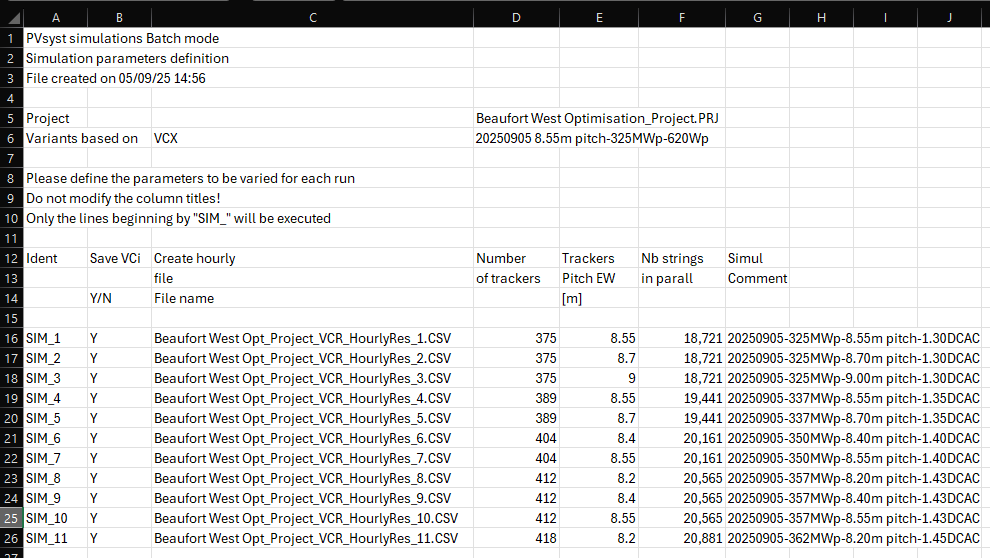
I have a problem in a configuration of a system as proposed by PVsyst. The system is composed by 367 strings of 25 AIKO Comet 2U 650 Wp in series. I'm investigating the use of the SMA Sunny Highpower Peak3 180-21. PVsyst 8.0.15 is proposing me 26 units of the inverter. It means the use of 26 string boxes: 23 making the parallel of 14 strings and 3 grouping 15 strings. Taking into the account the Imppt max current of the module equals to 14.76 A at 70°C, and the max input curret specified by SMA for the inverter equals 180 A and the max ISC curr 325 A, both numbers of strings in parallel mentioned before, 14 or 15, exceed (206.64 V and 221.4 V respectively) the max current input specified. How is possible that PVsyst proposes me the said configuration see the attached screen shot RfG European Network Code Configurazione SMA SHP180-21.pdf
-
 fabrizio joined the community
 -
Dear Ahmad, We are not familiar with Odoo in detail, but from what we understand it appears to be an ERP/CRM system. PVsystCLI is a command-line program that can be executed dynamically through scripts and can generate different types of outputs. If Odoo has scripting capabilities and can process the outputs from PVsystCLI, then a connection between the two tools would indeed be possible. Could you please clarify the specific functionality or workflow you would like to achieve by interfacing PVsystCLI with an ERP or CRM? Best regards,
-
 Bruno_Rot joined the community
 -
 yamahaoutboards6 joined the community
 -
 Siddanth Gokuldev joined the community
 -
 Dear Shivya and Ben, This is difficult question and we do not have a direct answer. As a first approximation, the structure shading could be estimated as the ratio of the area covered by structures to the photovoltaic area. In this approximation, the effect of structures is therefore their projection on the rear plane. Therefore, it neglects the fact that light may arrive on the rear side from multiple directions, akin to diffuse light. This approximation is hence likely an underestimate of the shading loss, in full generality. Indeed, even if structural elements are not directly in front of the rear side of modules, they may cause significant shading. A better approximation is beyond the present possibilities of PVsyst. Then there is the the variable for the mismatch loss factor, caused by a heterogenous irradiance distribution on the rear side. Any source of heterogeneous irradiance will cause electrical mismatch effects. Such is the case of shading cast by structural elements (but also differences in location relative to the environment and the ground). At present, PVsyst has no easy way to make an accurate estimation for these effects. Based on comparisons with measurement data, we have determined a default value (10%) for a general case. With beams covering the module width directly in front of the rear side of modules, the mismatch losses may increase drastically. In such a case, one can roughly estimate the mismatch effect as follows: as the current in a string is the current in the worst cell, if the structure covers x% of one cell, the shading effect will be x% for the concerned string. For example, the loss may be reduced by a factor of 2 if the structure covers half a cell (or two half cells).
 -
hello, Can PVsystCLI be connected to Odoo?
-
 Ahmad Sheikh Mohamad joined the community
 -
Sudden Load Profile Spikes After Importing File
André Mermoud replied to Ady's topic in Problems / Bugs
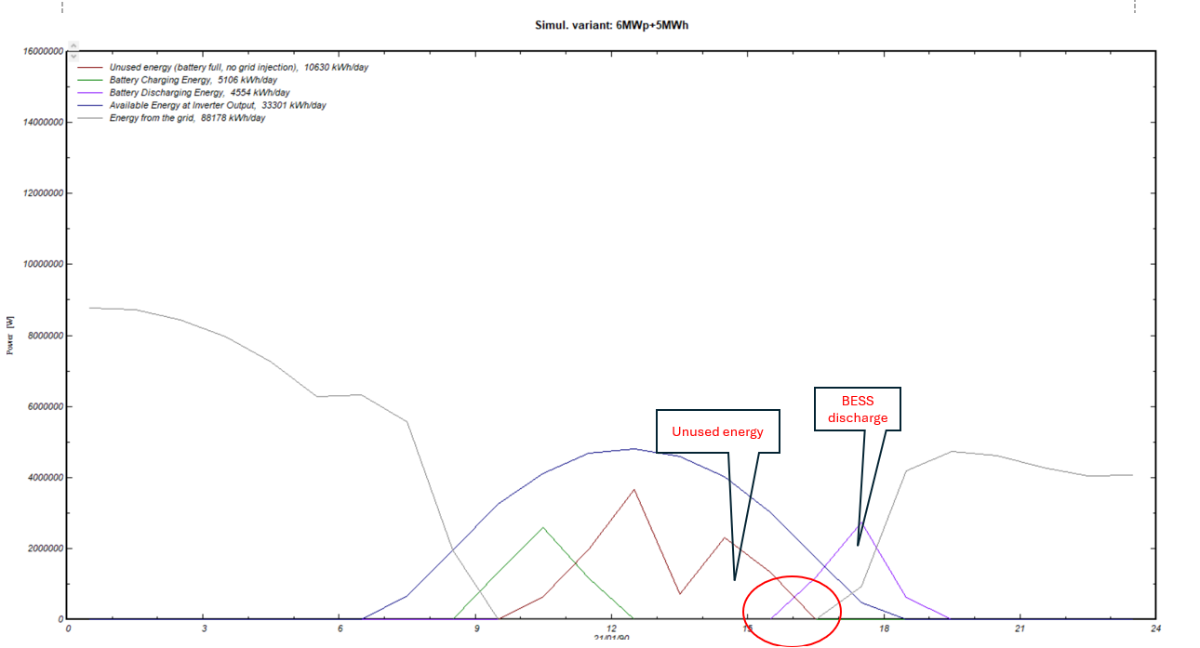
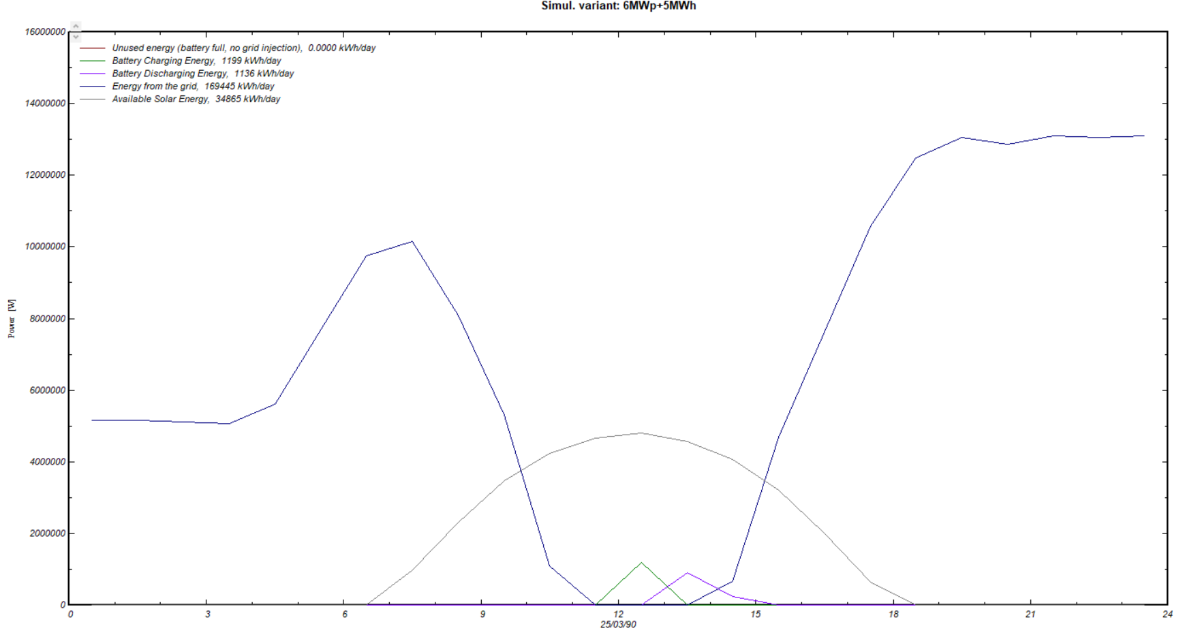
Please remember that we are working in hourly values. And the thresholds according to the battery SOC may arise during the hour, so that the transition from an operating state to another one may arise during the hour. Therefore you can have a "Battery full" state at the beginning of the hour, and a discharge during the rest of the hour. However there is also a visual artefact because you are showing lines from the middle of hour to the middle of the next hour. In your first plot, at 13:30 you have unused energy, but no BESS discharge. At 14:30, you have BESS discharge, but no Unused energy. The intermediate lines don't have any meaning. -
No sorry it is not possible to divide your system in the batch simulation.
-
I’m seeing an unexpected overlap in the results for a project with ~6 MWp PV + 5 MWh BESS (see attached screenshot). Simulation setup: self-consumption with storage; grid injection disabled. Issue - 1st screenshot Around late afternoon (≈16:30–18:00 in the attached plot), the curves show “Unused energy (battery full, no grid injection)” and “Battery Discharging Energy” occurring in the same time window. My expectation is that if PV is being curtailed because the battery is full and export is not allowed, the battery should not discharge during that same period unless the load exceeds available PV and the battery can no longer charge. Issue - 2nd screenshot "Battery Charging" and "Battery Discharging" accure in the same time window. please clarify.
-
hi, able to solve the above issue.. thanks.
-
 Mathew Komabo joined the community
 -
Hi everyone I would like to use the aging tool to model 35 years of generation based on Canadian Solar bifacial monocrystalline panel (CS6.2-66TB-H). Could you please recommend a value for "Av. degradation factor" for such panels? Does the default value for "Imp RMS dispersion" and "Vmp RMS dispersion" assume any panel replacement during the 35-year project lifetime? My company used string inverter monitoring and drone scan to spot defective panels and replace them. Heavily degraded panels might be moved to the same array and replace by new panels at some point in time. Over the project lifetime, we estimate that up to 25% of the initial panels will be replaced. This strategy shall mitigate mismatch losses to some extent. How can I take this into account in the "Imp RMS dispersion" and "Vmp RMS dispersion" values? Thank you Best regards Simon
-
 Simon 33 joined the community
 -
Can I use the batch simulation feature instead when I have many inverters? If so, how can I use this?
-
 Can PVsyst please comment on this post? I have the same question and want to add that there are a lot of sources that recommend calculating the structure shade factor simply by taking the ratio of the width of the racking (or torque tube) on the rear side by the length of the module (assuming it's in portrait orientation). My concern is that this is not taking into account the electrical effect of shading a row of cells that is in series with the rest of the cells, i.e. the current will be reduced in the entire module if you shade just a single row of cells. So the calculation should be the width of the row of cells divided by the width of the racking or torque tube, correct? This is in line with PVsyst's instructions, "the current in a string is the current in the worst cell, if this mechanics covers x% of one cell, the shading effect will be x% for the concerned string. This loss may be reduced by a factor of 2 if the mechanics is covering half a cell (i.e., the shade is distributed on 2 cells). " In summary, following these instructions, assuming the racking above shades 40% of the row of cells behind it, even if it's only 10% of the length of the module, would the Structure Shading Factor be 40%? Or 10%?
 - Earlier
-
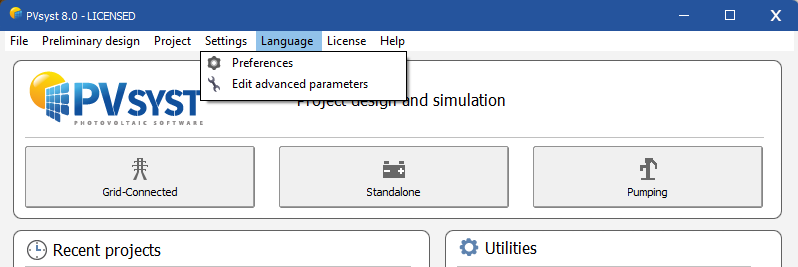
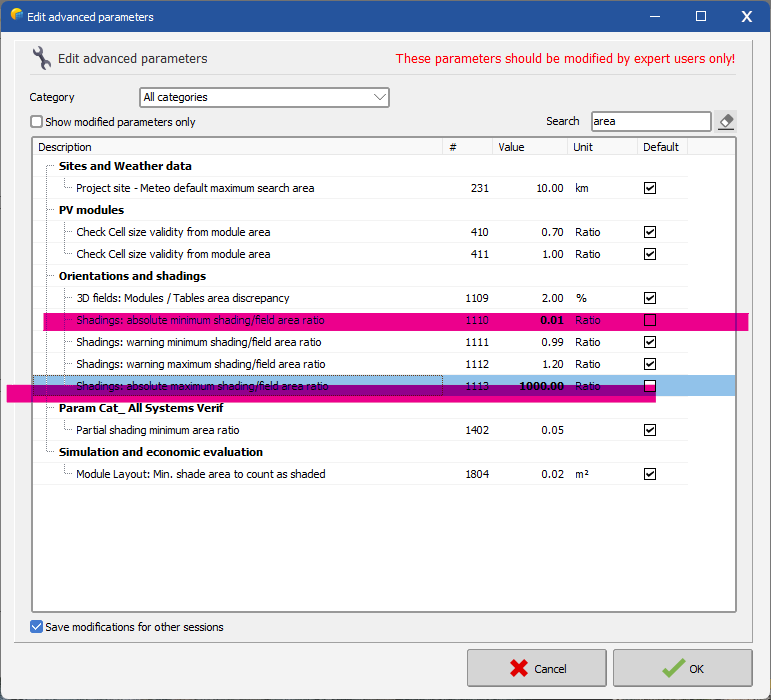
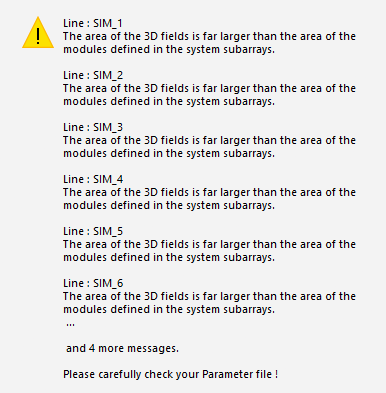
 Dear Johan, From your error message, we can see that the 3D scene is larger than the declared system. I noticed that you are changing the number of trackers in batch mode, while also modifying the number of strings in parallel. There is a workaround to make this work: In PVsyst, go to Settings → Edit advanced parameters. In the search box, type “area”, then adjust the parameter as highlighted below. Regards,
-
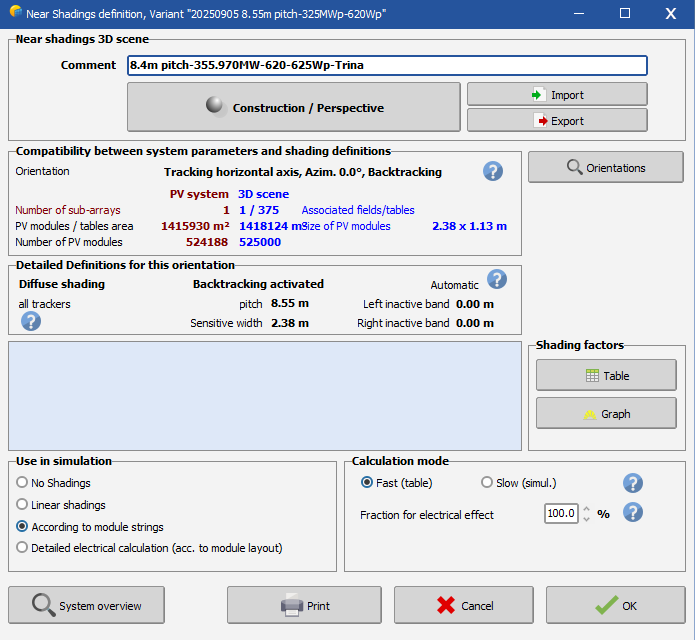
 I am getting the same error message when trying to run batch simulations. Any assistance would be appreciated. Images of error messages, Near Shadings screen and Batch file inputs included.
-
Indeed, the final simulation result always corresponds to the full system. To view the results of the individual inverters, you would need to simulate each one in a separate variant. Depending on how AC losses are defined, the two individual inverters should produce approximately the same as when they are simulated together, although some post-inverter losses may differ due to the lower total system power. If your full system has two inverter before the injection point, this is how you should simulate the system, rather than adding variants together. Separating the inverters into separate variants is a work around to evaluate the individual inverter performance.
-
Just to follow up on this. Let's say my whole system has 2 inverters. If I want to know the output of each inverter individually, I need to do two variants, with each variant having the defined inverters of my system. Then, if I run that and extract the csv file, will the E_grid of the two variants add up to the E_grid of the variant for the whole system? With this, can I say that this is how I can proportionate the output of the inverters?
-
Dear PVsyst team: For the Imp/Vmp contributions 80/20%, is there any relevant literature to support the value of this parameter? Thank you!
-
First of all, the inverter's behaviour with grid voltage deviations is very rarely described in the datasheets, and probably different for each inverter. By the way, PVsyst doesn't treat possible Grid voltage variations along the time. This is not part of the input variables, and we really don't see from which source we could evaluate it in prevision simulations.
-
Dear Renan, Thank you for reaching out. For "--output-csv-file" and "--report-pdf-file" options, you need to specify the file name with extension, not only the folder: --output-csv-file:"C:\Users\renan\.........\Resultados\Results.csv" --report-pdf-file:"C:\Users\renan\.........\Resultados\Results.pdf" If the problem remains, please export your log files by using the command: PVsystCLI export-logs Once the logs zip file is generated, please send it to support@pvsyst.com Best regards.