All Activity
- Past hour
-
The voltage drop of a PV array doesn't make much sense, as when the R*I² loss increases, the Pmpp will move on the I/V curve, and therefore the current will also be modified. PVsyst doesn't provide any guidelines for this difference between Power loss and Voltage drop, which depends on the I/V curve. We consider that the voltage drop is not defined, and of no interest in the case of I/V curves.
-
 jeremy.ligibell joined the community
 - Today
-
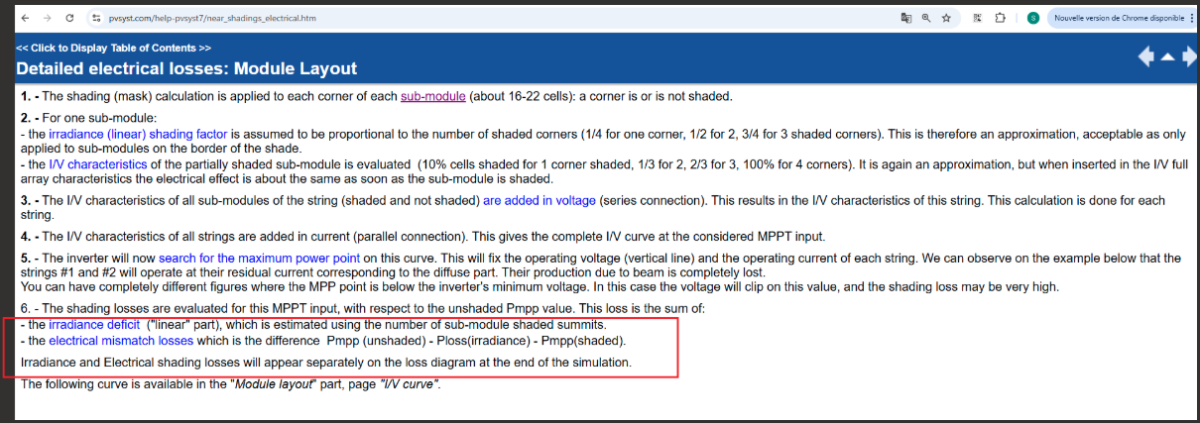
Electrical shading loss has been around for a long time. It is likely the 7.2 report was run on linear shading, or the site was modeled perfectly flat with backtracking enabled and no shading objects present to cause electrical shading loss.
-

Representation of gaps along tracker when using PVcase scenes
dtarin replied to LauraH's topic in Shadings and tracking
You can change the settings for both types of messages. The shade scene module count has no impact on simulation results.
-
OK,thanks
- Yesterday
-
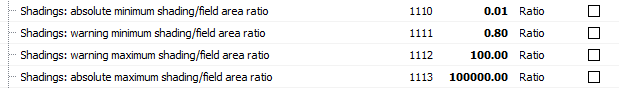
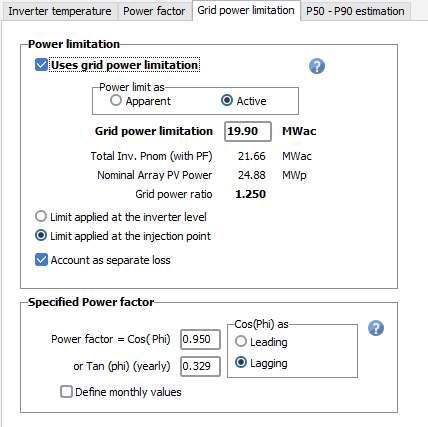
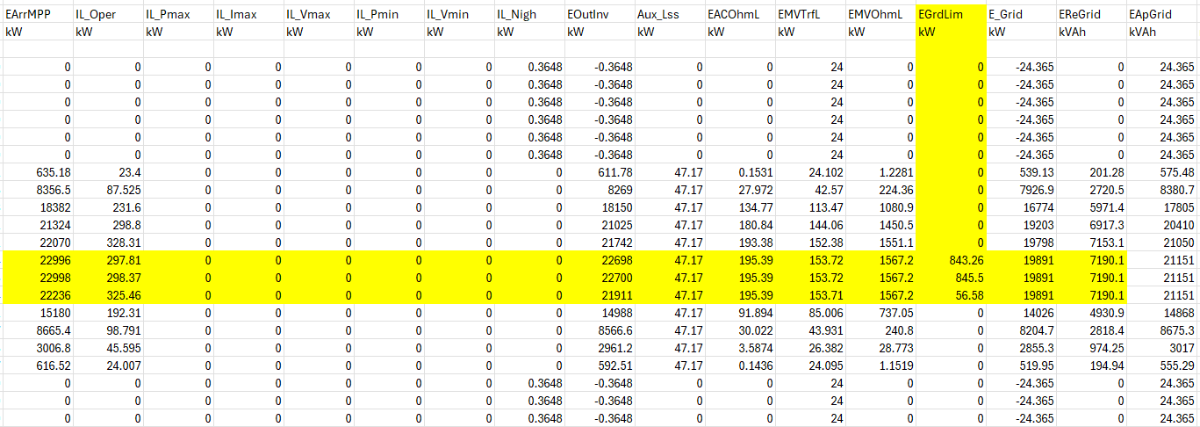
 Hello, I have noticed a behavior when simulating a PV plant with an active power injection limit at POI. In the output CSV file, the power seems to start being limited slightly before reaching the configured threshold in the simulation settings. I am attaching a screenshot of both the CSV output and the configuration parameters for reference. Could you please clarify why this limitation is applied earlier than the set value? Is this an intended behavior in the model or is there a specific setting that I should adjust? Thank you for your support. Best regards,
-
 Hi, Whenever I read in a PVC file for a shading scene, the array area and number of modules shown by PVsyst don't match the array design. After some thought, it seems that the array size is being inflated by the size of various gaps along the tracker: gaps between modules, motor gaps, and potentially joint gaps. Is there any way to correct this? It causes error messages. Optimally, PVsyst would get this information from the PVC file.
 -
Hello, I calculated the voltage drop of a string, and the resulting power loss was only 0.03% lower than the voltage drop. As you mentioned, the percentage of power loss tends to be slightly lower than the voltage drop. Is there a recommended guideline or acceptable range for this difference (for example, should it typically fall between 0.5% and 1% lower)? In my case, I obtained 1.49% voltage drop and 1.46% power loss. Kind regards,
-
 DUARTE Jean-Marc joined the community
 -
 N.Y. joined the community
 -
 kasemsin joined the community
 - Last week
-
 Ana Sofía Lanza joined the community
 -
Hello, Indeed there can be big discrepancies between databases. It is very difficult to estimate which one is the best suited for a given project or location, and what the probable error is. The following Help page provides comparisons of several databases across different sites: https://www.pvsyst.com/help/meteo-database/import-meteo-data/data-source-comparison.html?h=meteo+comparison#comparison-between-several-data-sources-for-different-continents
-
Hello, Does anyone know whether Meteonorm or SARAH3 is the most accurate database for France? Do you know of any scientific papers on this topic? Thank you in advance.
-
 Robert Boateng joined the community
 -
Hello, would it be possible to update the design to be more accessible. For example the green, orange and red dots are not usable, if you have a Green Red Blindness. So it would handy if there be a Mode with signs instead (like x, o, check). Best Regards
-
 additiondare joined the community
 -
 ruthik joined the community
 -
 KevinsNuast joined the community
 -
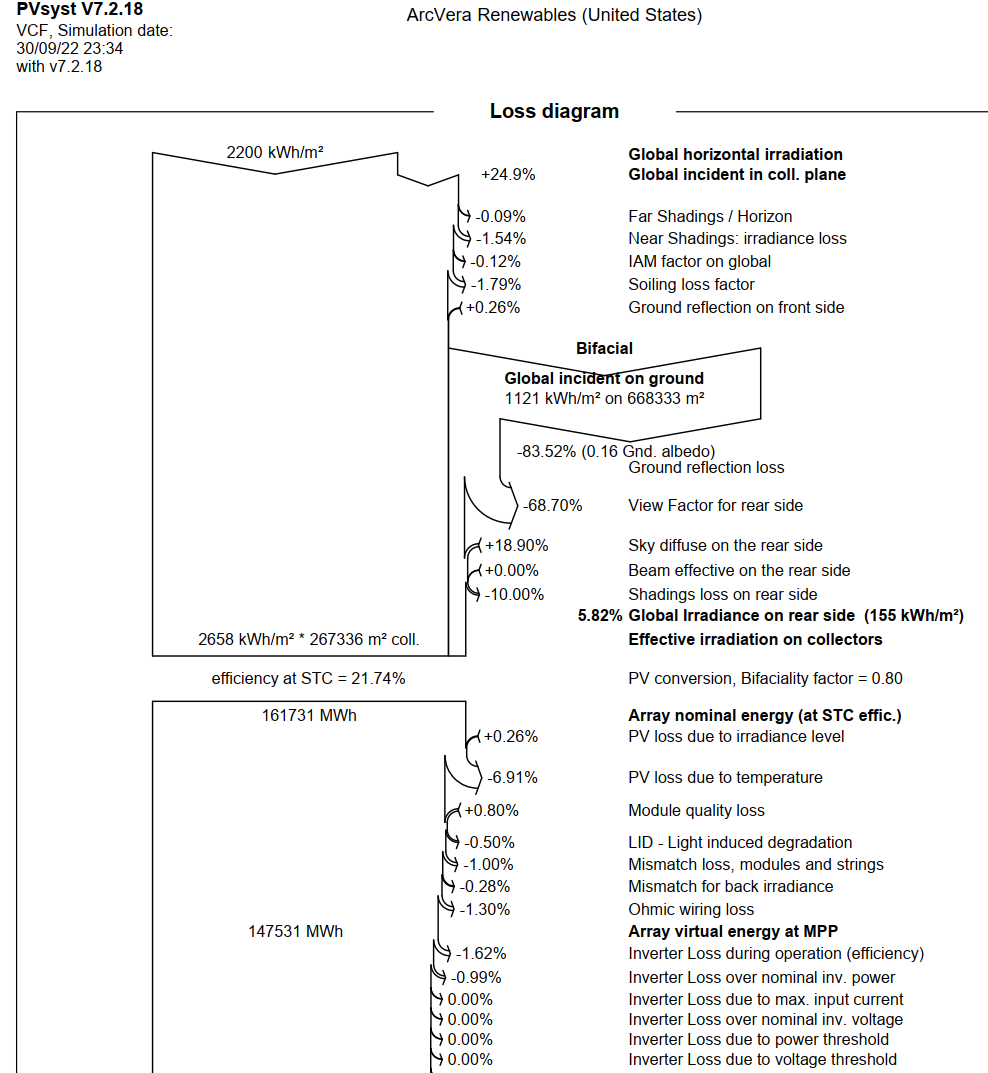
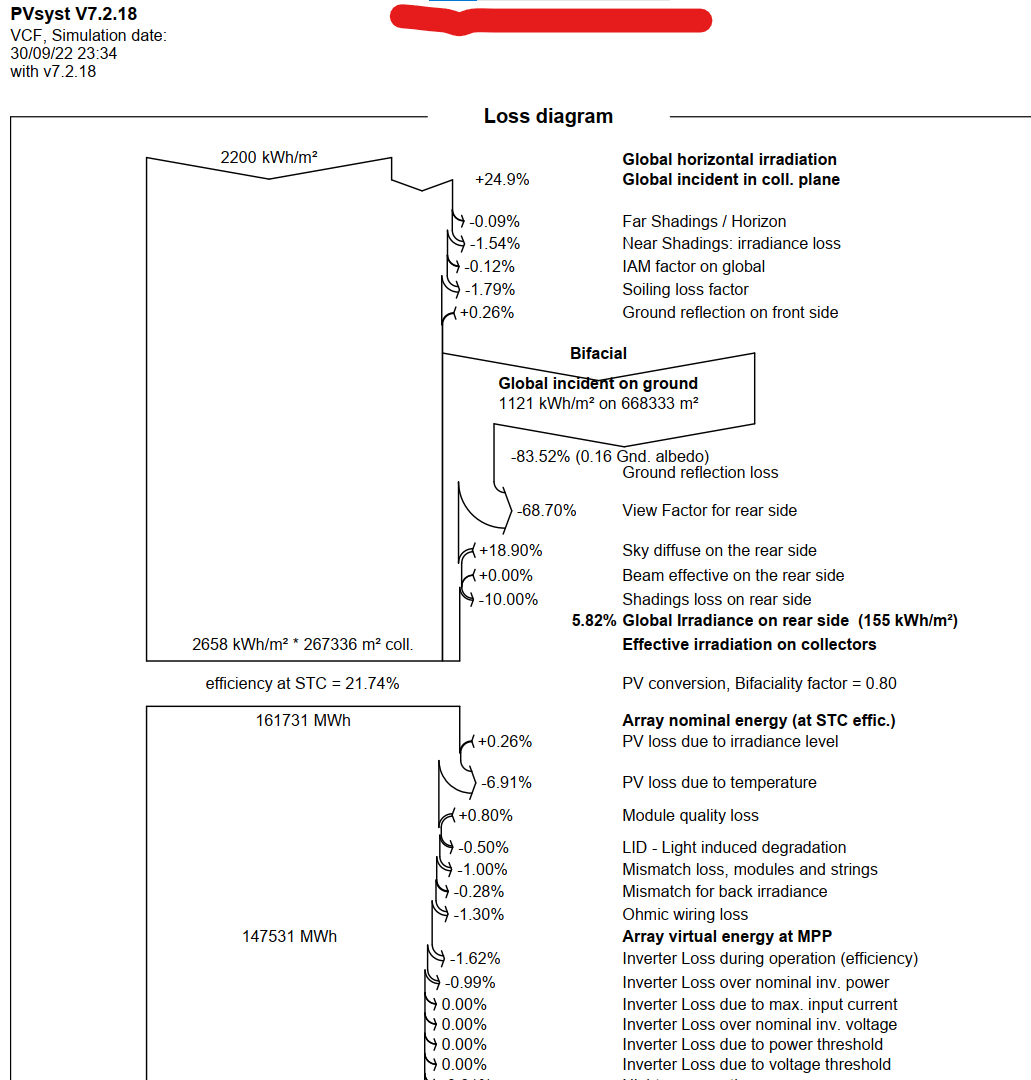
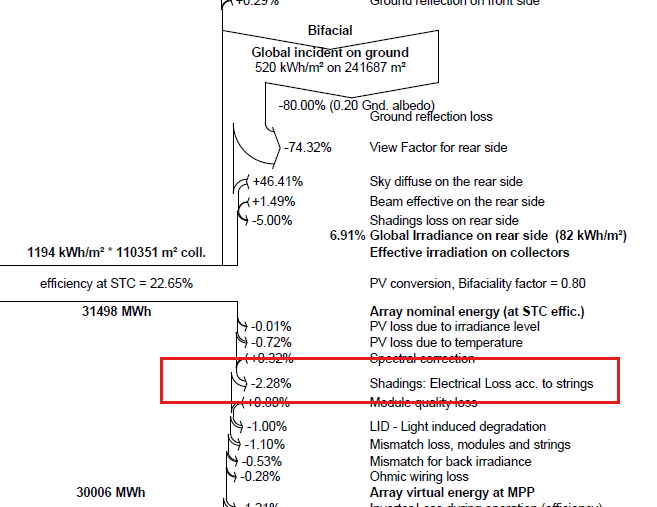
Dear @LL , Since which version of PVsyst it is presented in the report the correspondent electrical mismatch losses? Our doubt is why it is not presented in an report from version 7.2.18 and since it made available by the tool. Below some pictures to better ilustrate the question. Thanks in advance! Report that is raising the doubt: Desired report (example):
-
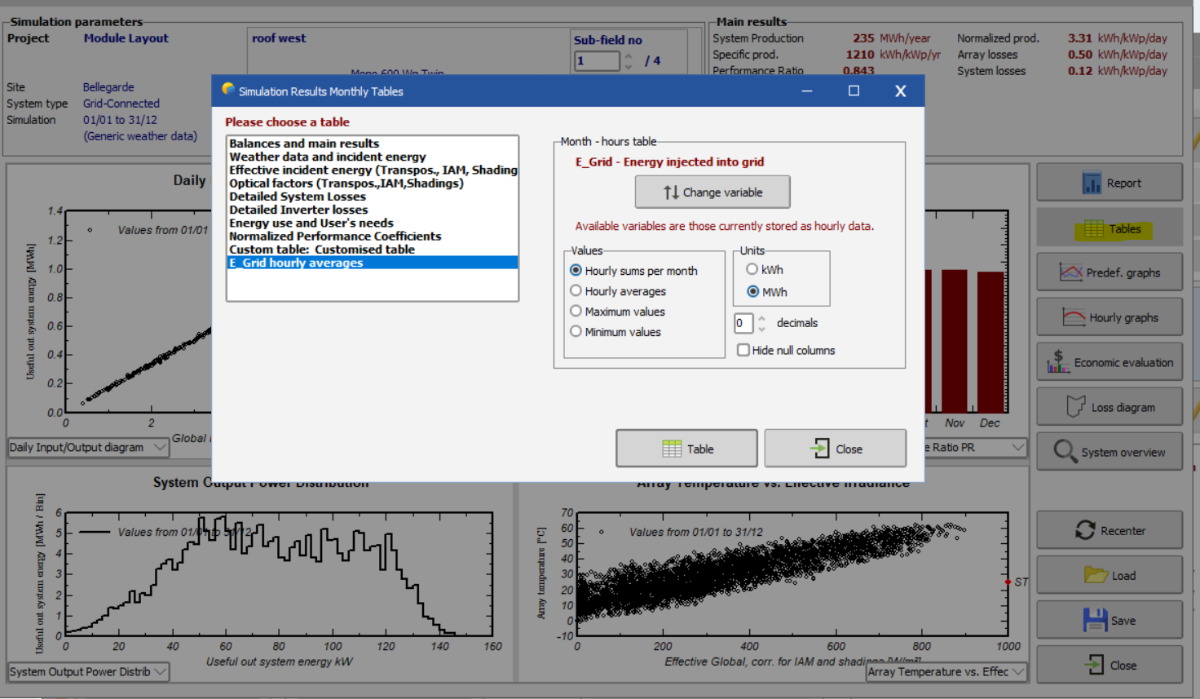
Hello, After running a simulation you have access to the "Detailed Results". In the "Tables" window, you can generate a table like the one in the beginning of this thread with E_Grid hourly averages
-
Hello, sorry about the intrusion, but how i can generate Monthly Hourly averages for E_Grid?
-
Hello and welcome ! The first steps of how to import custom weather data into PVsyst is explained in our Help in the following link: https://www.pvsyst.com/help/meteo-database/import-meteo-data/custom-meteo-files/index.html Kind regards
-
New to Pvsyst here. I'm wondering how best I can import custom weather/solar radiation data into Pvsyst - could you share your best practice? Thanks.
-
Sorry, I can't understand that. Please send us your full project, using "Files => Export project" in the main menu. Send it by e-mail to support@pvsyst.com, and tell us in which variant you have this problem.
-

the cable loss of strings of bifacial system
Linda Thoren replied to Chen's topic in Problems / Bugs
Sorry I don't really understand what you want to. The Ohmic losses can be defined in the Detailed losses window -
 Why not group this "separate loss" with inverter clipping, near the center of the loss tree, rather than placing it at the bottom of the loss tree? Thanks.
 -
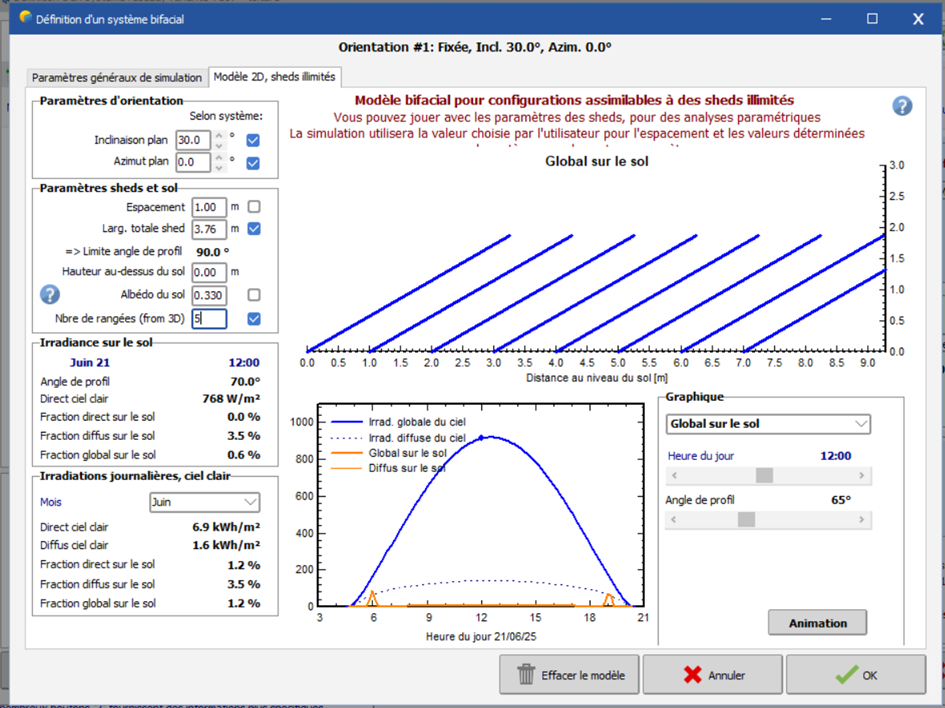
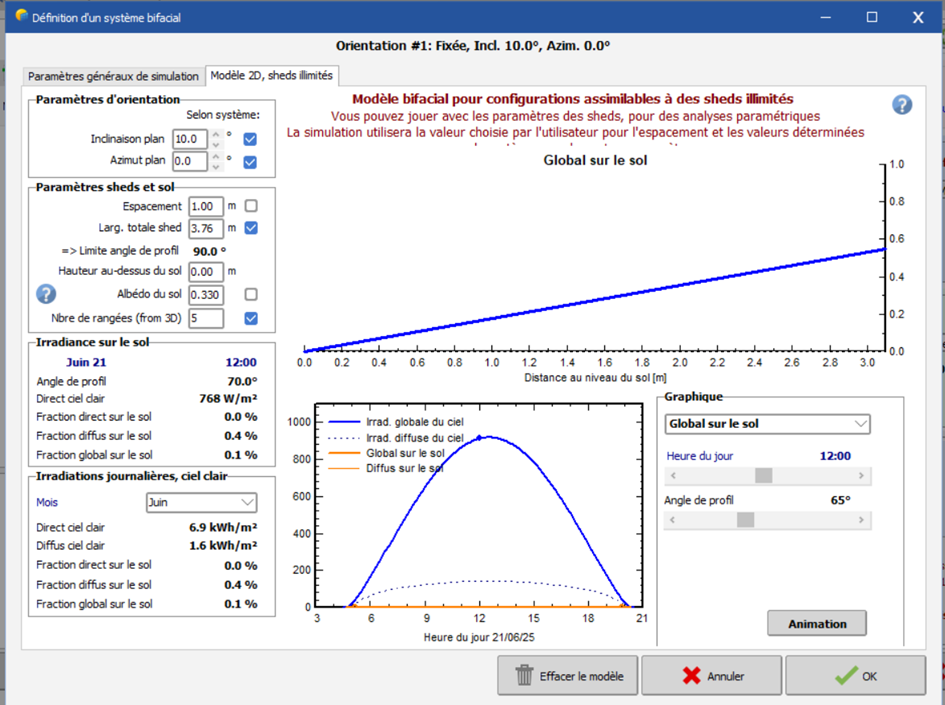
Bonjour, Dans vos exemples, l’inclinaison du toit est de 30° et 10° respectivement, et les panneaux sont-ils installés directement sur le toit incliné ? Dans ce cas, il n’est pas possible de réaliser une simulation bifaciale, car peu ou pas de lumière atteindra l’arrière des panneaux. Si les panneaux sont installés sur un toit plat avec des tables inclinées à 30° ou 10°, la simulation bifaciale est possible. Dans ce cas, l’espacement entre les rangées devrait être supérieur à 1 m si la table mesure près de 4 m.
-
Ok,I wonder if our software can be considered this.
-
the cable loss of strings of bifacial system
Linda Thoren replied to Chen's topic in Problems / Bugs
Dear, indeed, the total current should be considered. -
Bonjour, Je suis en train de réaliser une comparaison entre un système bifacial et monofacial sur plusieurs types de structures dont: une toiture inclinée à 30 degrés et une autre inclinée à 10 degrés. Or, mes résultats pour la toiture à 30 degrés ne sont pas cohérents car il y a une différence de productible entre bifacial et monofacial que je ne devrais pas avoir vu que les modules sont très proches de la toiture. De plus, pour la toiture inclinée a 10 degrés je n'ai pas ces différences. Je pense que la différence vient de la définition du système bifacial. Comment ça se fait que les schémas soient aussi différents alors que les paramètres sont les mêmes ? Par ailleurs, les scènes 3D sont identiques, mise à part l'inclinaison du toit et des modules. Comment est-ce que je peux obtenir le même schéma, c'est à dire une ligne linéaire mais avec une inclinaison à 30 degrés ? Ceci n'est qu'une hypothèse donc n'hésitez pas à me dire si vous pensez que cette différence vient d'ailleurs. Toiture 30°: Toiture 10°: Merci!
- Earlier
-
Thank you for your response. The problem persists even when I move to the next page and select the default value. Regards.
-
Dear sir: For the bi-facial module system , when calculating the cable loss of strings, should the current on the rear side of the modules be considered in our software? thanks!
-
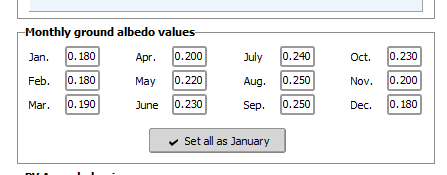
hey PVsyst. tabbing through the albedo table no longer works correctly. this is an issue after .14.