jfish
-
Posts
16 -
Joined
-
Last visited
-
I see that we now have an option to create shading factor tables on partial 3d models but I am unclear what steps to take to take advantage of this feature. I have looked through the forum and help files and cannot find instructions. Can someone please explain the steps necessary to utilize this feature so that I can more efficiently model large tracking arrays? I have tried the "partial shading calculation" option but I must be using this incorrectly since I am not getting useable results (I get shading fraction of 1.0). Also can you explain what "optimized shading calculation" is and when it should be used? Thank you,
-
Just wanted to report that printing of reports including 3d scenes in v 6.3.4 have become very slow. I also notice that perspective lines are now being drawn across the entire page, not just within the scene box.
-
Thank you for the clarification Andre. Might I suggest that you make clear in your help documentation and in your other support locations such as: http://forum.pvsyst.com/viewtopic.php?f=19&t=1752 that database items in the PVsyst component database may be overwritten without any warning dialogue during version upgrade? Additionally I think it would be important to make sure users understand that there is no indication that these files are changed when they are overwritten during an upgrade and these changes can impact previous models that used this component definition. I understand the complexity of maintaining this sizable component database and want to say that the addition of this database to the PVsyst program does increase the value that your software provides. My suggestion for you as you continue to develop this program is to develop a new policy when manufacturer's request changes to their component, or for any other reason that components are changed in your database, that a new file is added and a new version number attached to the file name. The old file should stay unchanged. The "data source" value is a handy place to place a date stamp for the new version identifier if you want to keep the same model number for the component. My concern here is not that manufacturer's change their specifications, I understand that and agree that that is not your responsibility. My concern and the reason for my suggestions is that these changes appear to happen automatically during a PVsyst upgrade and that those changes happen without any indication to the user that they occurred.
-
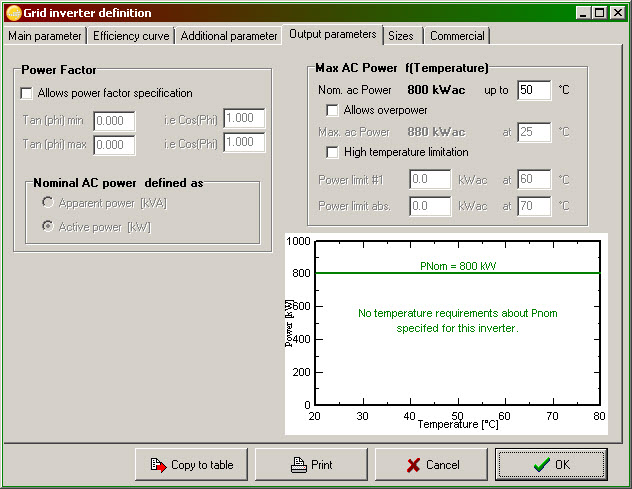
I'm happy to do that Andre but I think I am getting a better understanding of the changes, though I am still confused how these changes were implemented. I went back and looked at the variants and inverter databases for these two simulations, one in v6.3.1 and one in v6.3.2. I have gotten in the habit of always doing a parallel install which I find very helpful when upgrading since it helps me in better understanding the changes made in each new version. I confirmed that no changes were made to the variant file between the two simulations. The change appears to only be in the inverter database entry and was not done by me. I am attaching two images of the the inverter I modeled from the inverter database. One is when accessing the database in v6.3.1 and one is when accessing the database in v6.3.2. The inverter entry in the database from v6.3.1 shows the ability to limit output power based on temperature but it does not have an adjustment variable set below 50C: The same inverter entry in the database from v6.3.2 shows that a temp adjustment variable has been set for down to 25C: I did not make this change to this database component. It appears to have been made during the upgrade. If this was a change to the PVsyst component database, shouldn't a new database item have been created, keeping my old version unchanged? Perhaps this is really a question about how component database items are handled during version upgrades. I was always under the impression that component files were unique and static once I import them, unless they are overwritten. So in this case can you help me understand this process? Was there a change to this inverter definition between 6.31 and 6.32 and if yes, how does this change occur? Does PVsyst overwrite old database items during upgrades? If the answer is yes, can this be changed to give users an option? I would have expected that the user would be given the option to accept/reject any changes to these files since a change to an inverter affects all previous simulations using that inverter, which is in general, not desirable. Also on this subject is there a way that in the PVsyst report you can make a note that inverter output to ambient temperature adjustment has been used? I want to make clear that I appreciate these changes in principal since the ability to model different inverter performance at different ambient temperatures within PVsyst is a great new feature. I am only trying to better understand how changes are implemented and what I can do as a user to identify changes and prevent them if I do not want them made automatically. Thank you,

-
Andre, Yes I am using an SMA inverter but I don't see how this change came from the manufacturer. It looks like this change was from v6.31 to 6.32 only. I am using the same variant file and settings and same custom OND file between my two simulations using v6.31 and v6.32. There is no change made by me to the variant or OND files between the two simulations. In 6.31 I get clipping to Pnom and in 6.32 I do not. I realize that the SMA SC inverter can be set to adjust Pmax based on ambient temperature but prior to PVsyst v6.32 PVsyst used the value Pnom to clip inverter output, the Pmax setting in the OND file did not appear to do anything. There were no other settings available in inverter OND files for ambient temperature adjustment prior to v6.30. It appears that you have now changed the programming of PVsyst and the format of OND files so that adjustments to PV output power is now made? Is that correct?
-
Andre, Was there a change from 6.31 to 6.32 in how the simulation treats inverter output real power limit? I just upgraded and had to go back to an earlier variant that I had modeled in 6.31. When I re-ran the simulation I saw that the peak output of the plant was significantly increased from the 6.31 simulation even though I had not changed any parameters or components. I went back to my v6.31 PVsyst version (I did a parallel install which I recommend to anyone) and saw the values return to the original outputs one I re-ran the simulation in 6.31. The only loss I see that changed in the waterfall chart was "Inv loss over nominal power". Since I am modeling an inverter that has different "nominal" and "maximum" values in the OND file I am wondering if you know are using the "maximum" values in the simulations or if there is any other simple explanation for this behavior?
-
Hi Andre and all, First I must say, thank you for fixing the speed issue found in previous versions (pre 6.26) when trying to import a variant from a previous project. I can now use this very important feature again. I have had problems saving these imported variants after I import them though. After creating a new project file and selecting a past variant to form the basis of my new variant, the program does not confirm that the new variant saves when I try to save it. It does not show up in the variant pull down box until after I shut down then restart the PVsyst program. That is when I first see the new variant. Hope that helps identify and fix the bug.
-
I have had this problem as well but have found a (temporary) fix. It appears that V6.23 will now only print to the default printer as identified by your PC. In order to change printers since upgrading to 6.23, I first go and change the default printer in Windows then open PVsyst and print the report. If you change your default printer to your PDF compiler, it should work for you. This bug needs to be fixed soon though since this is an unnecessary pain for the user. An odd bug, funny how these things pop up from revision to revision with seemingly no connection to stated upgrades. Because of odd bugs like this, I am now in the habit of always doing a parallel upgrade with each revision.
-
When using v6.17and printing a report, but selecting only Main results and Loss diagram pages, the Simulations parameters page is still printed but the Main Results page is not, it appears to be attached to the bottom of the first page but is lost. Not a major issues but a bug nonetheless.
-
I just found a bug in 6.16 that occurs when viewing a summary table for a single Meteo file, the total is the table is not shown correctly and appears to be the value for the December data: https://dl.dropboxusercontent.com/u/37960429/PVsyst_6-16_Meteo%20bug.jpg Jason Fisher Charlottesville, VA, USA
-
Hi Andre, I just upgraded to 6.14 from 6.13 and see odd numbers in the simulation summary screen: https://dl.dropboxusercontent.com/u/37960429/PVSyst%20614%20bug%20summary.jpg The correct numbers appear to show up in the printed report: https://dl.dropboxusercontent.com/u/37960429/PVSyst%20614%20bug%20report.jpg Not a major bug but something I thought I should report. Jason Fisher Charlottesville, VA
-
Hi Andre, I have just completed the upgrade to 6.11 and see that we are again allowed to model single axis backtracking trackers using the simple orientation method and no longer are required to construct a 3D scene. When I just tried this I no longer see "Near Shadings: Irradiance Losses" in the report. It was my understanding that the previously discussed diffuse shading's losses added to version 6.10 reported these losses in this category of near shadings loss. Does this mean that diffuse shading losses are not calculated in 6.11 when not using the simple backtracking method (not constructing a 3D scene)? Are these diffuse shading losses only calculated for systems with 3D scene's constructed? Jason Fisher Charlottesville, VA USA
-
Interesting Andre, thank you. Can you tell us what tilt this system was modeled at? If tilted above 0 degrees from horizontal is it possible for you to analyze a zero-tilt (horizontal) single axis system as well? Those are the systems I have been modeling that are giving me confusing results. If this is a zero-tilt single axis then it appears that I am getting much different results. I would be happy to send you my models to analyze. Jason Fisher Charlottesville, VA USA
-
I have tried to make clear that I am not asking for an explanation of the detailed algorithms and inter-functionality of the PVsyst tool, nor am I suggesting that this tool should be expected to be a tool to predict the future. I view it as counter productive to simplify this discussion to those points. Let me more briefly summarize the important issues that I am trying to discuss in my previous posts on this subject: 1) A major change was made to the tool from version 6.08-6.10 (6.09 was immediately replaced by 6.1). By "major" I mean that it impacted previous simulations of tracking systems (at least the horizontal SA trackers I have modeled with 6.1) by between 2-3% in annual production. My personal feeling is that this version change should not have been released as an "upgrade", this change in shading modeling is a fundamental change from the original v6.0 release, not a bug fix, so in hindsight I feel that a parallel installation should have been encouraged at a minimum. This change has made it impossible to rerun any tracking simulation performed in any version prior to 6.10 without significant alterations to the original model. By making this comment I am trying to encourage the developers of PVsyst to consider these impacts for future changes. This is not a complaint forum so that is not what I am doing here. 2) The new losses for tracking systems labeled "Near shadings: irradiance loss" that account for adjacent row/column diffuse radiation shading seems rather high to me compared to other array geometries at the same geographic location, using the same meteo file, and the same system losses. I am not asking to see the formulas but rather am asking what we have as users of the tool to better understand this effect. Third party papers, studies, white papers, etc. are examples. The best would be one or more independent studies comparing these new PVsyst methods to other methods and better yet, actual field performance. As the industry has developed over the years, other issues have generated similar discussions and independent analysis of modeling software's assumptions, including PVsyst. 3) Numbers generated by PVsyst (and other tools though PVsyst is clearly the most widely used) are used by the market to assess the value of PV systems so as much as possible the industry should be aligned on these numbers. For this discussion the "accuracy" of this tool is relevant I feel. By "accuracy" I mean how well does it model arrays deployed in the field that match the variables as input in the tool and the meteorological conditions. In other words has someone seen the level of diffuse shading loss on backtracking single axis trackers that are now built into the tool? Most probability analysis performed by independent consultants hired by investors include uncertainty factors for irradiation and weather resources, but also for the modeling tool (perhaps 5% on average). Is there an argument to be made that these changes should now lower that uncertainty for the PVsyst tool? I think we all understand that there will be a range or error band to all energy modeling tools but as we know, investors tend to focus on worst case. Most people accept PVsyst based numbers a representing a P50 number. If our tools become overly conservative this will keep trending the value of PV systems lower. That is just a general comment by me that I ask others to consider, I do not have a particular ask of the developers other than to continue to support their users as much as possible to understand the numbers generated by the tool. Jason Fisher, Charlottesville, VA, USA
-
Thanks Andre as usual for your well reasoned and thoughtful explanation of the good work you are doing with PVsyst. The intention of my original post is not to demand answers but rather to spark debate so I appreciate you adding to the discussion. My comments around the financial impact of these changes is (like it or not) based in the reality of our market right now. I completely understand your position that this is a modeling tool and not a tool to predict the future! The reality though is that the PV market only grows with the adoption of the technology by people who are not as familiar with these systems as you (who eclipses all of us with your knowledge), or I, or my good friend Marvin. Developers, investors, builders, owners, and maintenance firms all look to performance modeling tools for answers to the tricky question of how these systems are expected to perform. Those of us in the position of explaining these tools must be able to reduce a great deal of complexity into clear and defensible explanations of the inputs and outputs of these models. We need to have a high degree of faith in these tools and for me, that faith comes from understanding them as best I can. That is what was on my mind when starting this thread, how do I explain this change? How do we discuss previous simulations? How accurate are these assumptions when compared to what we see in the field? The same debate happens everyday with other simulation details whether they be on voltage drop, soiling, etc. I realize that you cannot tell us what values are "true" and what are "false" but in this case, this change to the tool has produced a very significant change in the model's results which for me merits extra consideration and explanation. Despite your very comprehensive and clear explanation I still have concerns over how the new algorithm is being applied. I would not attempt to challenge your equations but I would like to be able to understand the results better, and thus explain them better. Today I modeled a new horizontal tracking system in the northeast US. Using PVsyst v6.1 the simulation resulted in a -3.7% Near Shadings loss (0% loss reported in pre 6.1 versions). I then modeled a fixed tilt array of the same size and equipment, using the same Meteo resource and system losses. The 0 degree single axis tracker was 0.33 GCR and the fixed tilt array was 25 degree tilt and 0.43 GCR. Both were modeled in the 3D scene. The Tracker used backtracking and the fixed tilt modeled electrical losses according to strings. The result for the fixed tilt was -2.9% Near Shading losses. Lower losses than the backtracking single axis 0 degree tracking system. I am still confused by this. It simply does not make intuitive sense to me. A backtracking horizontal tracking system spends a significant portion of the most productive part of the day and year at very low tilts, which based on the little I know about this subject would suggest that any diffuse losses would be extremely small during this time, just like when we model low tilt fixed tilt systems (i.e. 10-15 degrees). Furthermore when each tracking column is tilted (thus blocking some diffuse from it's neighbor) it is in the lower irradiance periods of the day when the total irradiation of both diffuse and beam is of lower total significance to the daily system production. In contrast a fixed tilt system has a geometry that never changes so diffuse irradiation blockage from neighboring sheds is an effect which occurs throughout the day. It just doesn't add up to me. Another way to look at this question is by looking at the Global incident in the collector plane differences between these two systems. My GHI for this site was 1371 kWh/m2. The horizontal tracking system with backtracking added 25.1% to this value. The 25 degree fixed tilt (0 azimuth) added 15.0%. This is a difference of 10.1% additional irradiation of the tracker, marginal but understandable in this region. When I deduct the near shading losses of -2.9% for the fixed tilt and -3.7% for the tracker I now only get a incremental improvement of 9.3%, with all system losses I only see +9% energy harvest for horizontal tracking at this site. Incidentally at a second site I modeled in the desert southwest doing the same comparison using v6.10, I got similar results, near shading losses for the horizontal tracker were about 1% higher then they were for a fixed tilt system and the resulting net energy gain was about 19%. This is a lower gain than is typically seen in the field. Thus my concern. Is this tool becoming overly conservative? I am not suggesting that PVsyst should remain static, I really appreciate the continuous improvement you have shown in the development of this tool. It is a great tool not just to model system production, but to explore various designs and even to illustrate complex PV theory. If my thread does spur some discussion and investigation into this effect, I might suggest that when planning major changes like this in the future, you consider launching them as a beta version for a period of time prior to full "upgrade". This would alert users to consider upgrading immediately more carefully. I know you give us the option of parallel installation and at times I have done that, that method does get messy though for file management. I admit I have formed a habit to routinely upgrade my PVsyst software since your fixes and improvements are much appreciated. This change caught me off guard and so I am now trying to develop faith that the tool is predicting the "most likely" performance of a tracking PV system, I will avoid using the term "most accurate"! ;) Thanks for the discussion. I hope we can continue it. Jason Fisher, Charlottesville, VA, USA