Anna_Sweden
-
Posts
4 -
Joined
-
Last visited
-
I/V-curve problems in Module Layout
Anna_Sweden replied to Anna_Sweden's topic in Shadings and tracking
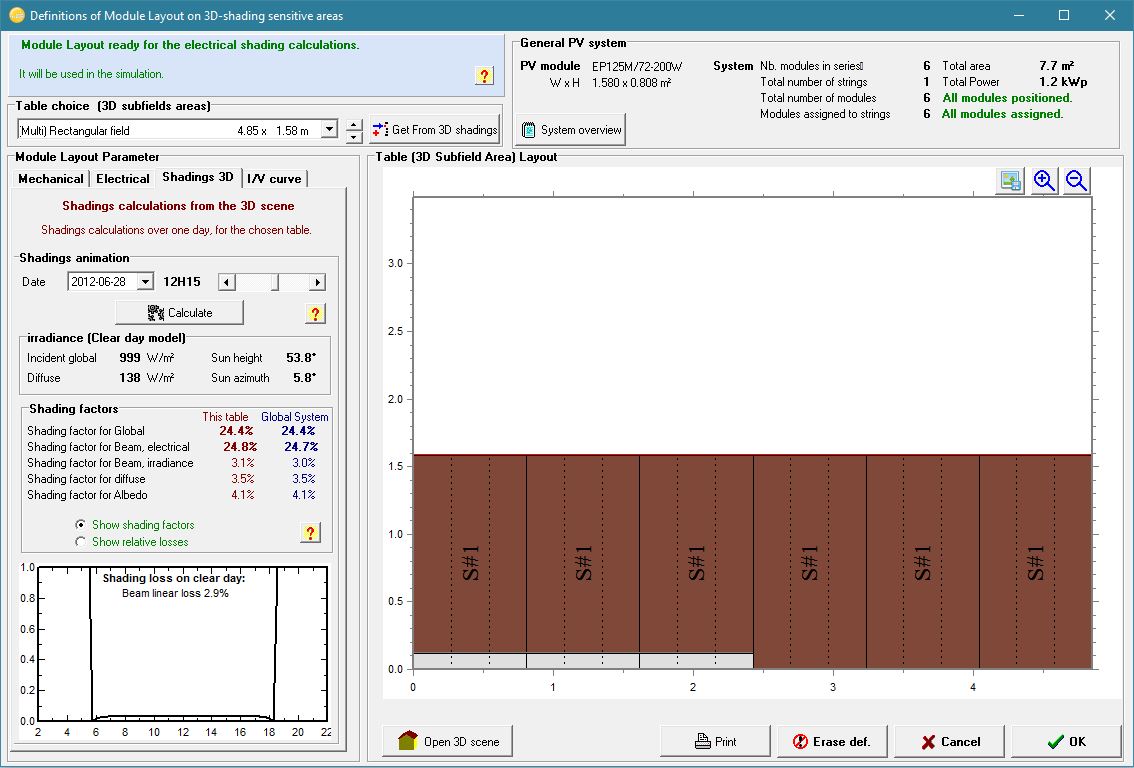
So you see the shadow is almost constant but the IV-curve is varying a lot. This is continuing all day, not just around noon. Do you know why? Is there anywhere I can read about the IV-curve algorithm to understand it better? I am really curious about your sentence "the shades don't affect the corners of the submodules, which are taken as reference for the shading evaluation in the Module Layout part". Anna -
I/V-curve problems in Module Layout
Anna_Sweden replied to Anna_Sweden's topic in Shadings and tracking
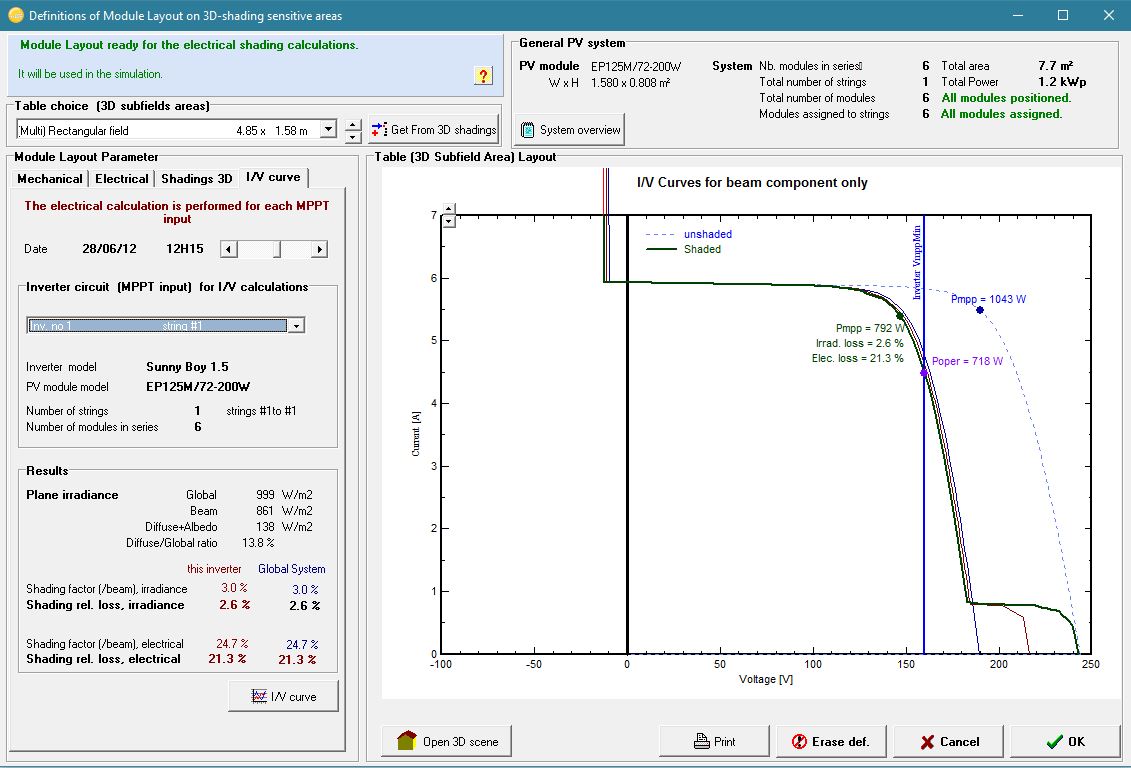
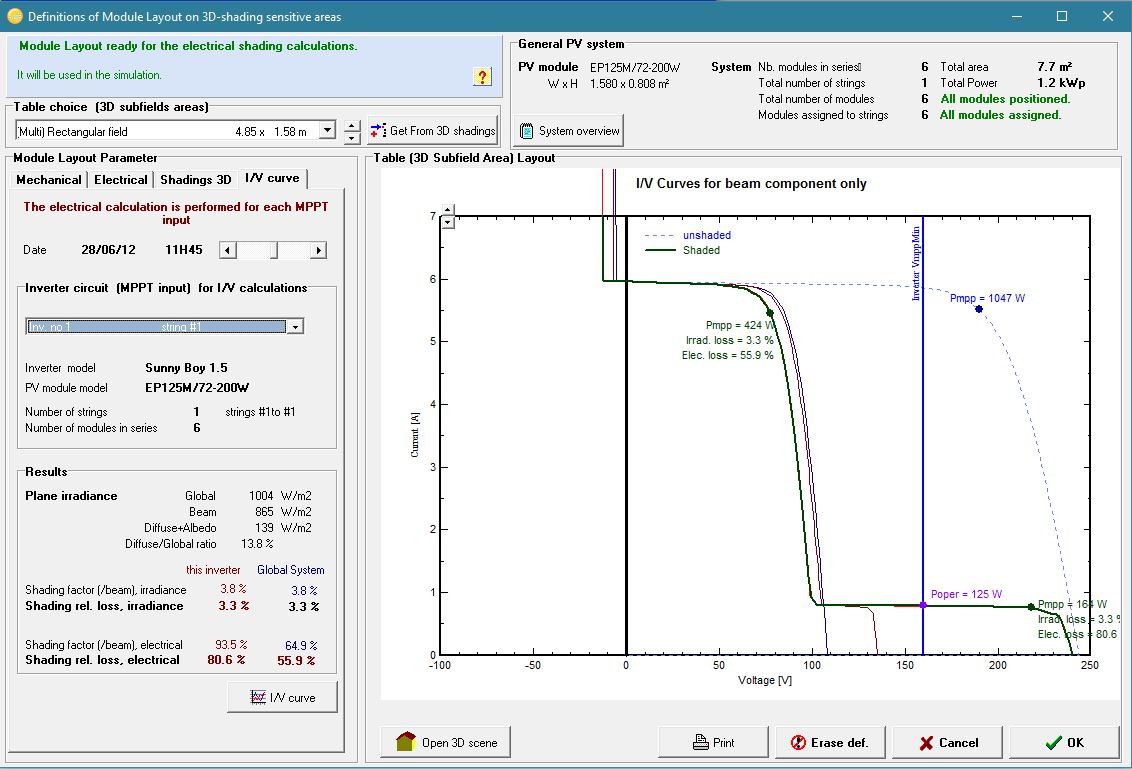
12.00: 12.15:
-
I/V-curve problems in Module Layout
Anna_Sweden replied to Anna_Sweden's topic in Shadings and tracking
Thanks for your quick reply! I did not realize I can attach images, but maybe that will make it easier to understand. 11.45: 11.45 Shadow 12.00:
-
I am writing a guide about shadings on PV-systems, hence I am really interested in the “Module layout” with the possibility to view I/V-curves. I have created a string with six 200 W modules, 60 cells, 3 bypass-diodes, connected in series to an inverter with one MPPT. I have also created a really near shading which, most of the day, is almost covering the lowest row in three of the modules. This should result in two MPPs: one with the three shaded modules included and one without them when the bypass-diodes are taking over. This is not the case. Instead I get various results during the day, even though the shadow is almost completely constant, for example: 11.45: full production, 1 MPP. 12.00: 2 MPPs - one with a really low current and one with approximatly half the full voltage. 12.15: full production, 1 MPP. I think the result at 12 is the correct one, the others are not. Why is this the case? Can I do anything about it? Anna