emn
-
Posts
5 -
Joined
-
Last visited
-
Problem solved by support fra PVsyst support, who gave me this hint: I have found the error that causes all your problems: the thousand separator character is automatically removed from all texts when converting them to a decimal values. This happens if your internationalization settings for the thousand separator are on “Windows settings” (as seen below) and your windows locale language is Danish, that defines the comma as decimal separator and the point as the thousand separator. The error leads to PVsyst removing all points from texts from the databases… and it’s quite normal that it behaves incorrectly or crashes afterwards!
-
I have just updated to 7.2.9 and when opening old or making new projects, the site database seems to be corrupted. :? Has anyone seen this behavior and if yes, do you have a workaround? File showing weird site database behavior

-
Hi I must have made something else wrong also, as I had made files with W, kW etc. without any luck. Now it works and it could be because I got confused by subhourly data and kW vs. kWh... Thanks for supporting me.
-
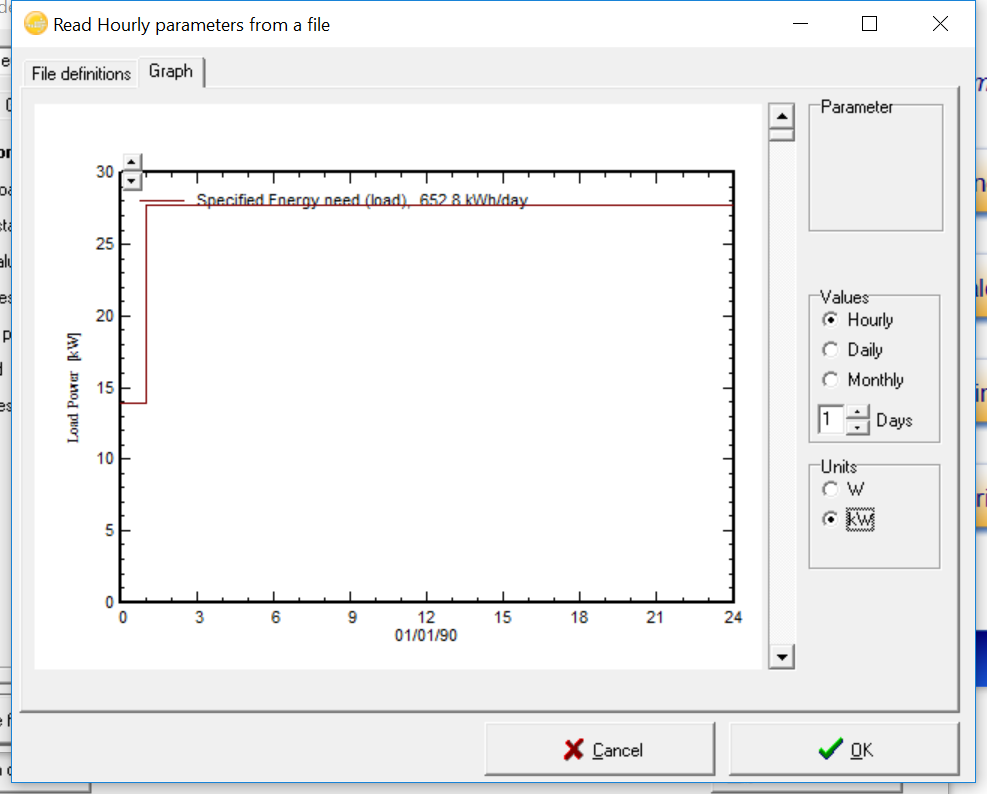
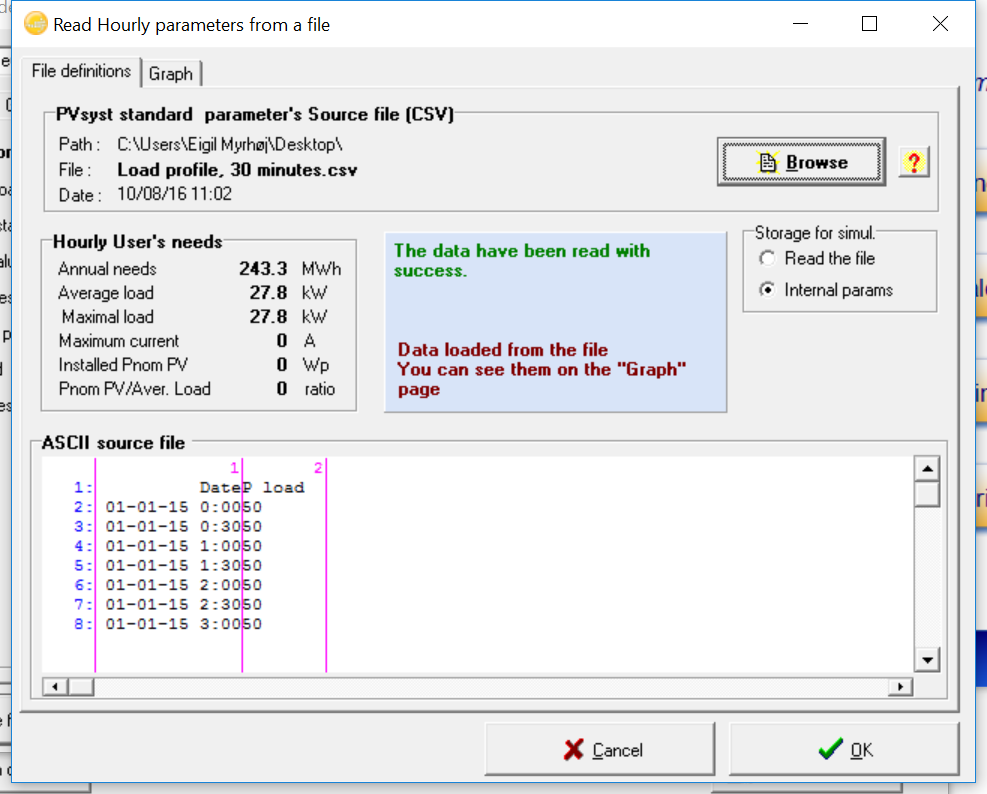
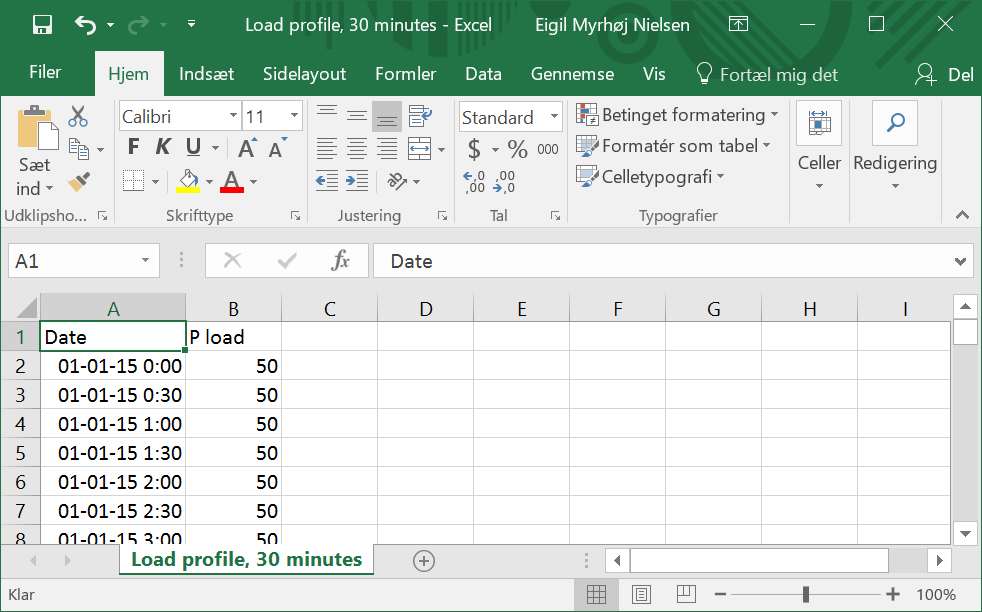
Hi Again I am using PVsyst 6.47 and follows the mentioned guide line. As I am not allowed to upload .csv or .xlsx files, I upload a screenshot of a 30 minute load profile example, which I have used for import evaluation. Screenshots from the import is attached and they show that the ASCII source file has valid data and that the first value in the file is not in the graph. When I make 15 and 60 minute load profiles, the exact same problem occurs. As you can see on the hourly user needs, the values computed in PVsyst are 3.6 times lower than the imported values. What am I doing wrong? Import graph showing missing first value from imported file Showing imported values from ASCII Source file Example file of load profile used for screenshots
-
I have imported a customers load profile according to the format described in "Hourly_Parameter_Template" and my success rate could be better :? . Then I have made a sample file with 1kW load per hour and imported it. It shows the right values in the table called "ASCII source file", but all values are divided by exactly 3.6 in the graph and simulations, evaluated by changing some of the hourly values to 3.6. Example from csv-file: Date P Load 01-01-14 0:00 1 01-01-14 1:00 3.6 01-01-14 2:00 1 By the way, the first hour of day one is not imported - from day two, everything is fine. It seems like I miss some basic understanding, so can you please help me out?