
Kanagavel K
-
Posts
10 -
Joined
-
Last visited
1 Follower

-
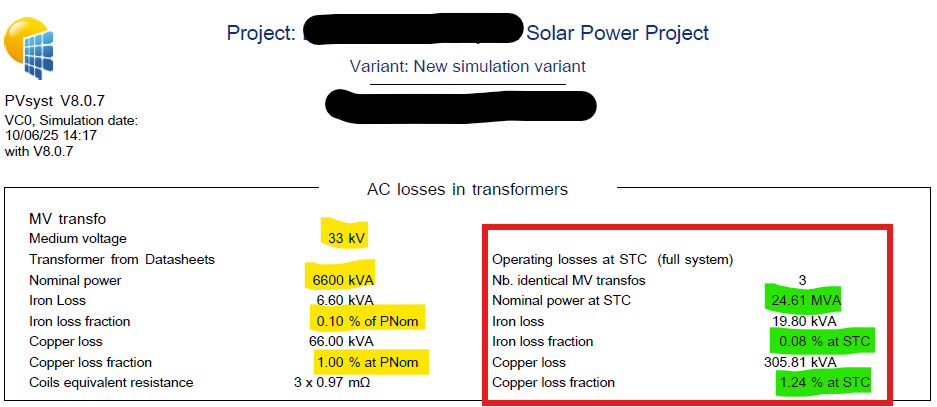
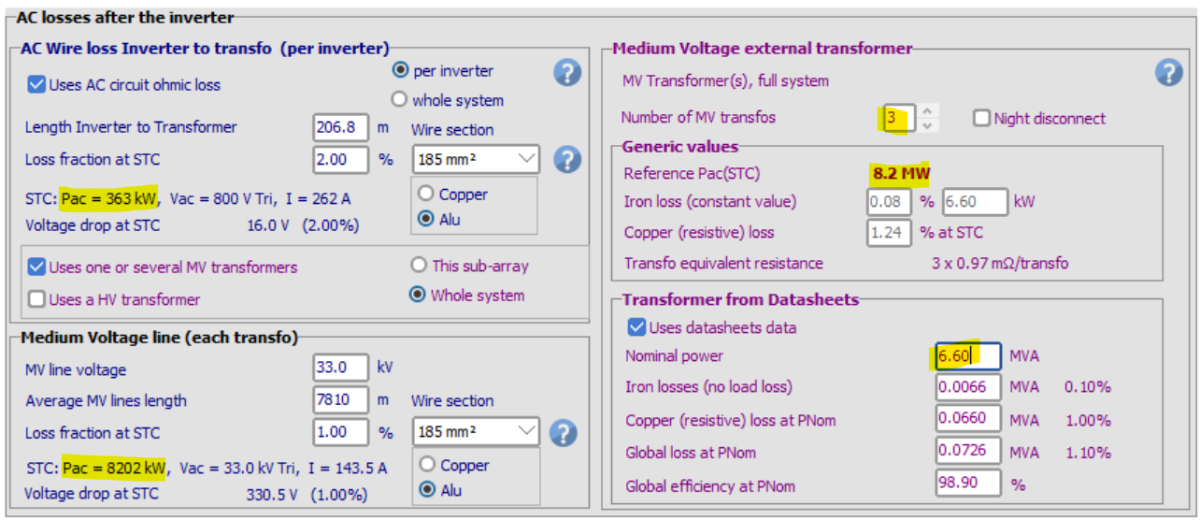
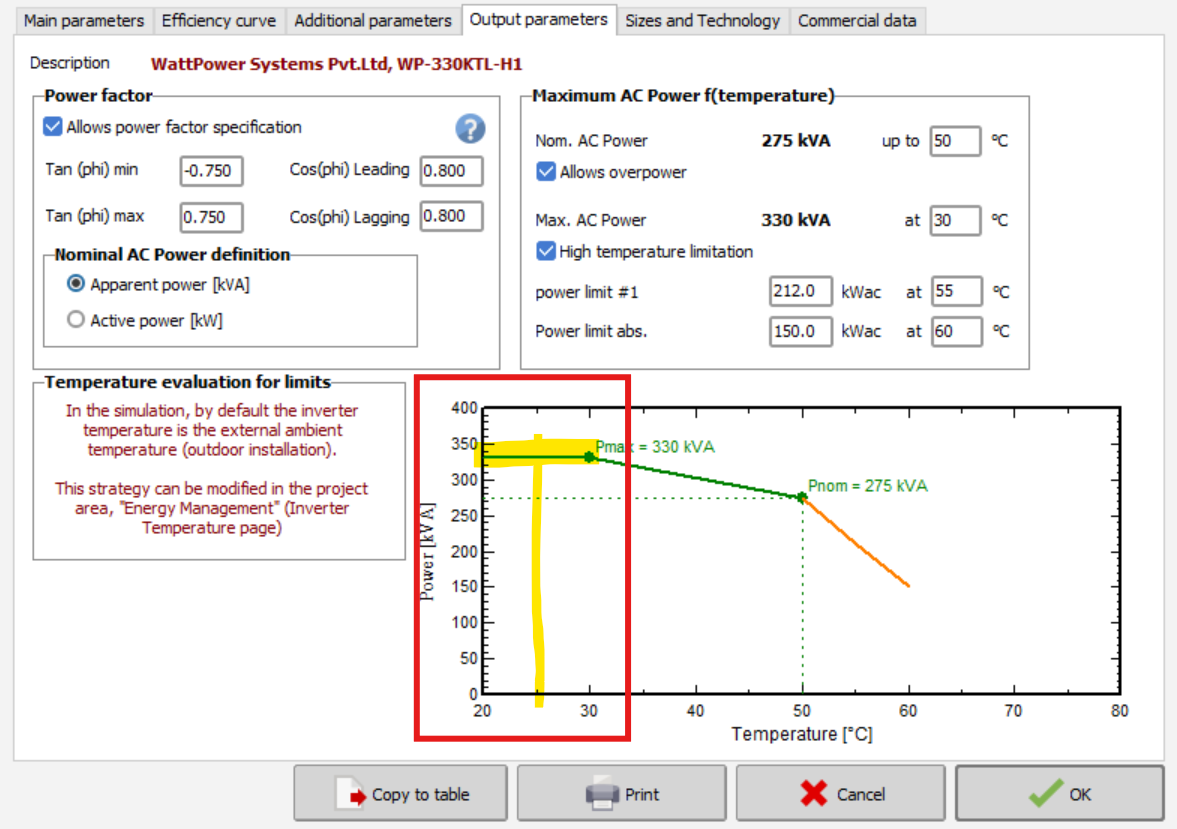
Dear PVsyst Team, I need some clarification on the AC Losses portion, 1) AC Transformer Losses portion While defining the losses from the datasheet tab (6600kVA Nom.Power) 3 Nos of Trafo is used in the project so total Nom.Power will be 19800kVA. here, the point to be noted is that no value of temperature is being defined in PVsyst. Then, how the Nominal power at STC calculation is performed in internal pvsyst (at transformer side). 2) AC Wire Loss Inverter to Transfo Inverter ratting Nominal power at 50deg is 275kVA and as per the power vs temp curve (image is attached here for the reference) 20 deg to 30deg the power is 330kVA only Then, how the Nominal power at STC calculation is performed in internal pvsyst (at inverter side).

-
PVsyst Aging _ Clarification on Degradation Calculation in PVsyst
Kanagavel K replied to Kanagavel K's topic in Simulations
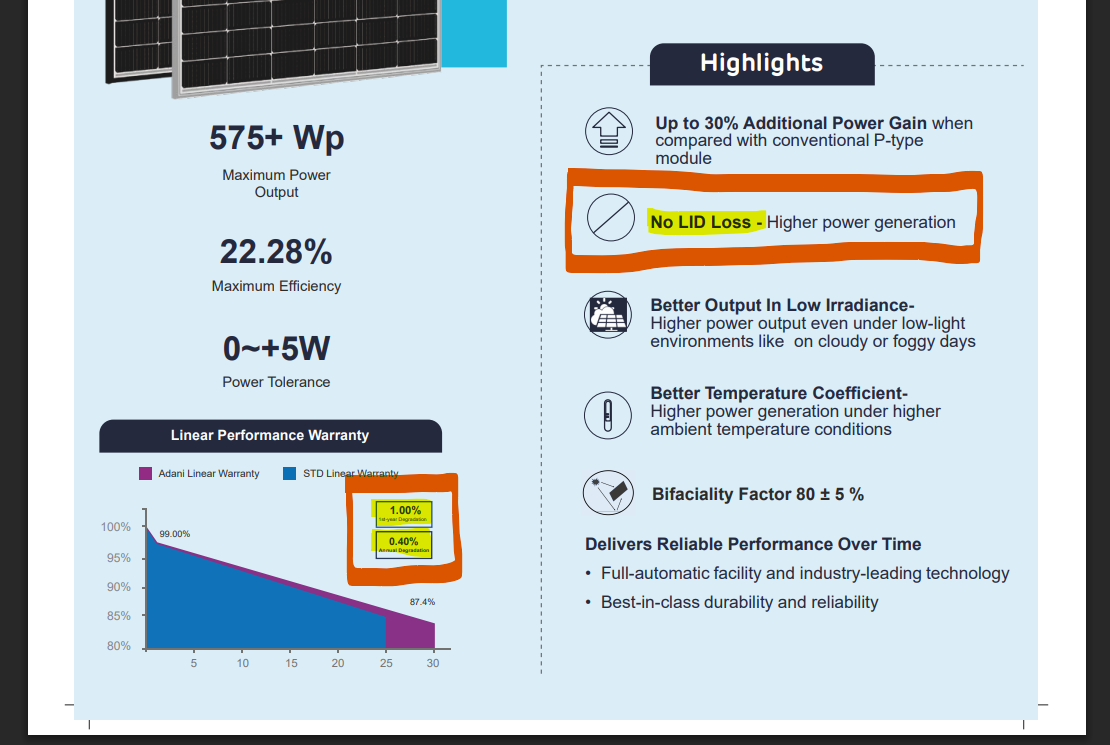
Dear PVsyst Team, I need one clarification on the LID and Aging parameter input. LID is "0", 1st year loss is "1.0%" and annual degradation is "0.4%" as i attached in the below datasheet for the reference in this case how should i defined the values in Pvsyst (LID, Aging). Thanks, Kanagavel K
-
Our team is developing a tool for solar plant feasibility study which requires an automated interface with PVsyst by which means like, if i feed the required inputs through my API, PVsyst should automatically consider those inputs and run to provide the result.
-
Dear Pvsyst CLI team, Is it possible to API Interface with Pvsyst CLI Thanks & Regards, Kanagavel K
-
PVsyst Aging _ Clarification on Degradation Calculation in PVsyst
Kanagavel K replied to Kanagavel K's topic in Simulations
Hi LauraH, Thanks for your explanation. -
Thank you for response In loss diagram Diagram, loss decimal value is only three digits is available. Can u please guid me how to take more decimal value in the pvsyst if possible.
-
PVsyst Aging _ Clarification on Degradation Calculation in PVsyst
Kanagavel K replied to Kanagavel K's topic in Simulations
Thanks for response For the further Clarification, If average of real degradation means then why only for first year is taking average and next will be actual. My recommendation is that the annual module degradation value can be set to 100% (or customizable) for the first year as well. This way, I can generate yield analysis based on the module warranty data. Thanks, Kanagavel -
Dear PVsyst Team, The string range in PVsyst is displayed according to the design temperature settings, if I’m not mistaken. After adjusting the design temperature to match only the minimum GHI available hours, the string range shows a larger size. This also match with our string sizing calculation. It would be beneficial if PVsyst could automatically recognize and adjust the design temperature based on the GHI available hours.
-
Dear PVsyst Team, I have a question regarding the flow of loss consideration. If the first loss of the module is the LID (Light Induced Degradation), then the annual degradation should likely be considered after the LID loss in the loss diagram. Could you please confirm if this understanding is correct? Let me know if I am mistaken in my question.
-
Dear PVsyst Team, I am working with an N-type Module that has 0% LID (as technology says) loss and would like clarification on how to properly apply the degradation values for simulation. The module datasheet specifies the following: 1st Year Degradation: 1% Annual Degradation (2nd year to 30 years): 0.4% However, I noticed that PVsyst assumes half of the annual degradation applies in the first year. This leads to some confusion regarding how to properly simulate the degradation over the 30-year period. To clarify, I am trying to split the LID and annual degradation using the following methods: 1. Case 1 (as per PVsyst): LID = (1st Year Degradation) - (Annual Degradation / 2) i.e., LID = 1% - (0.4% / 2) = 0.8% As per case 1, I can set the Input in PVsyst like, LID - 0.8% and annual degradation - 0.4% As per these results, PVsyst considers: 1st year - 1.0% (0.8% + (0.4 / 2)%), 2nd Year - 1.4% (1.0% + 0.4%), 3rd Year - 1.8% (1.4% + 0.4%) ,.......... 2. Case 2 (General Practice Approach): LID = (1st Year Degradation) - (Annual Degradation) i.e., LID = 1% - 0.4% = 0.6% As per case 2, I can set the Input in PVsyst like, LID - 0.6% and annual degradation - 0.4% As per these results, PVsyst considers: 1st year - 0.8% (0.6% + (0.4 / 2)%), 2nd Year - 1.2% (0.8% + 0.4%), 3rd Year - 1.6% (1.2% + 0.4%) ,.......... When using Case 2, the total first-year degradation will be 0.8%, which is lower than the module datasheet value of 1%. On the other hand, if I want to match the datasheet values accurately, I would need to use Case 1, which results in the actual degradation values throughout the 30years of entire simulation (both for the first year and for the following years). Also, Kindly clarify why PVsyst considers only half of the annual degradation for the first year? If the PV module vendor provides the LID value, how can we adjust the degradation losses in PVsyst to align with the datasheet values for the first year? Could you please provide clarification on how to simulate the full 30-year degradation, taking into account these considerations? I want to ensure the simulation should aligns with both the datasheet values and PVsyst’s recommended degradation approach. Thank you for your assistance.