Mariyam
-
Posts
7 -
Joined
-
Last visited
Everything posted by Mariyam
-
Thank you, Linda! This clears a lot of things!!
-
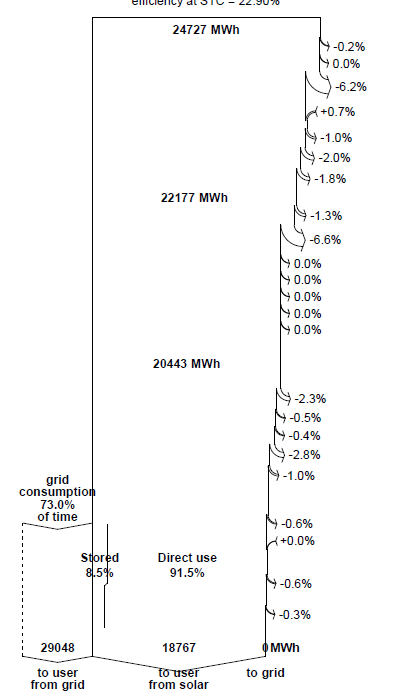
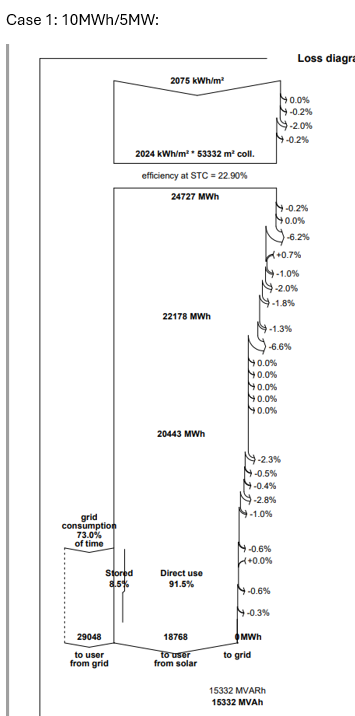
Hello Sagar, Thanks for your reply. The losses diagram also states the percentage of grid consumption, how do we arrive at this value? Its clearly not the solar share from the user's needs? Then what does it indicate?
-
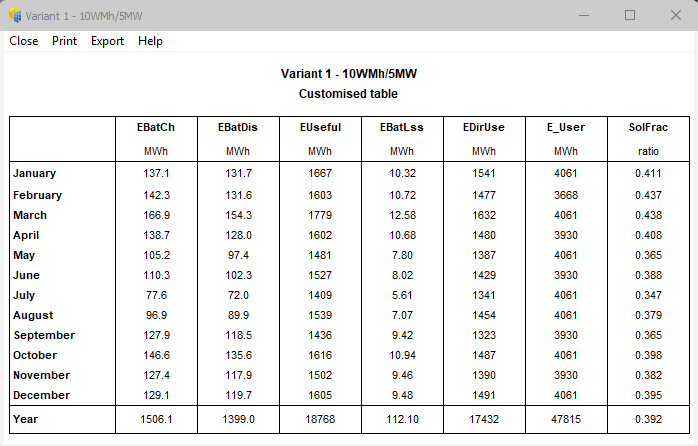
Hello, I am simulating a grid-connected 10MWh BESS PV system. From the losses diagram, I gather that the stored energy (usage from BESS) is 8.5% of generation = 1595.195 MWh/year; and the remaining 91.5% is direct use from solar = 17171.805 MWh/year. However, when I look at these values from tables: the EDirUse = 17432MWh/year and EBatDis = 1399 MWh/year; which doesnt match with the above values. Am I looking at the wrong values? Or does PVsyst give a highly approximate % of values from batteries and direct use? I have attached the table of values and losses diagram FYI.

-
Could you please elaborate on this further?
-
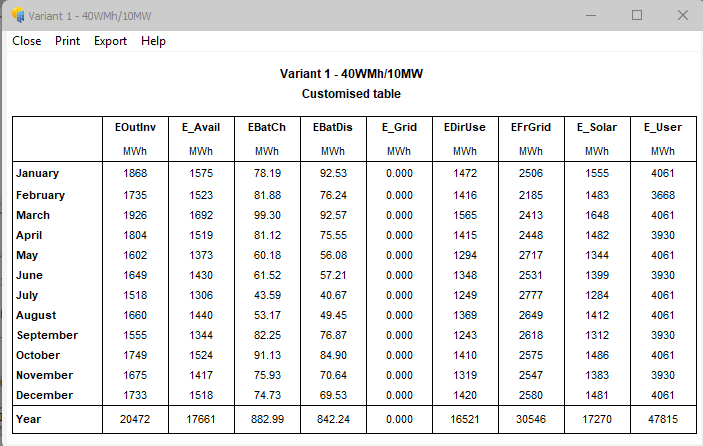
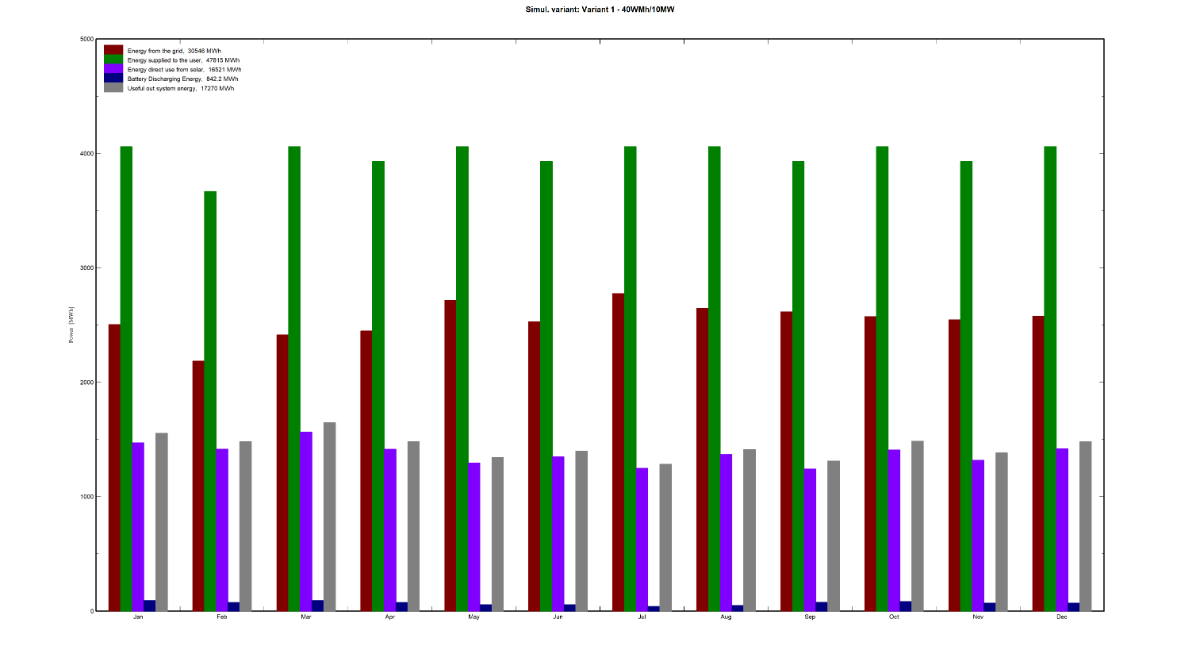
Thank you for clearing this. Is there any relationship between the values EDirUse, EBatDis, E_Solar, and E_User? I am trying to find what is the generation from the BESS and solar (only) as per hour values and add it to gain the total energy (E_Solar). I have attached the hourly generated graph and table FYI.
-
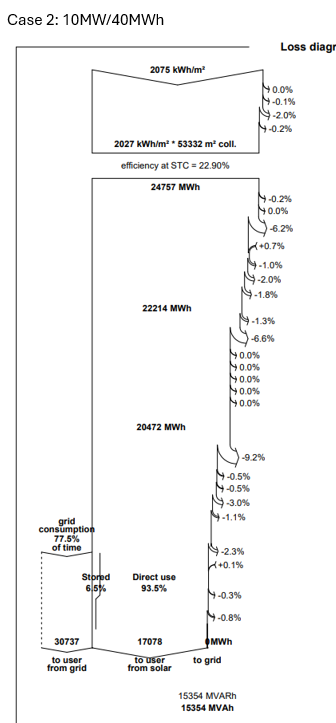
Thank you for clearing my doubts regarding the grid consumption. Like you said, I do realise the losses are higher in the second case (due to auxiliary power required for cooling of BESS), and so it makes sense to have lower solar production & higher grid consumption to meet the demand. But why is the percentage of stored energy lower in the second case? Does this value depend on the charging & discharging power?
-
I am simulating a PV farm with 2 cases of BESS: Case 1: 12.1 MWp with 10MWh Case 2: 12.1MWp with 40MWh After generating the results from the report, I can see that the % of grid consumption is higher in the 40MWh case than the other. Also, the stored energy is lower in the 2nd case, which is puzzling. I have attached the losses diagram. Can someone explain this discrepancy?