Hello, potentially a newbie question as my experience with the program is still in the early stages, but I was hoping someone has run into this issue before and might have some suggestions.
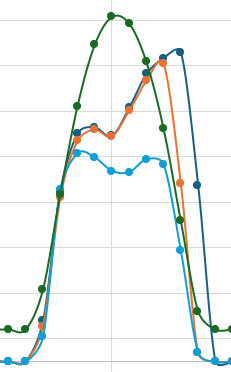
The following graph is of a day's hourly output and has 4 trends. I'm looking to understand what potential parameters I'm using that might be causing the inverters to increase in power output in the afternoon despite a declining GHI. I was hoping that the results were a result of poor shading parameter inputs. However, after including shading representative of the installation, the increase of output despite declining GHI remains (although the spike has become less drastic). Has anyone run into similar issues in the past?
Green = GHI
Light Blue = Meter Data
Dark Blue = PVsyst (No Near Shading)
Orange = PVsyst (Near Shading w/ Backtracking)