Mike99
-
Posts
9 -
Joined
-
Last visited
-
Getting error when trying to import Standard weather data file
Mike99 replied to Mike99's topic in Meteo data
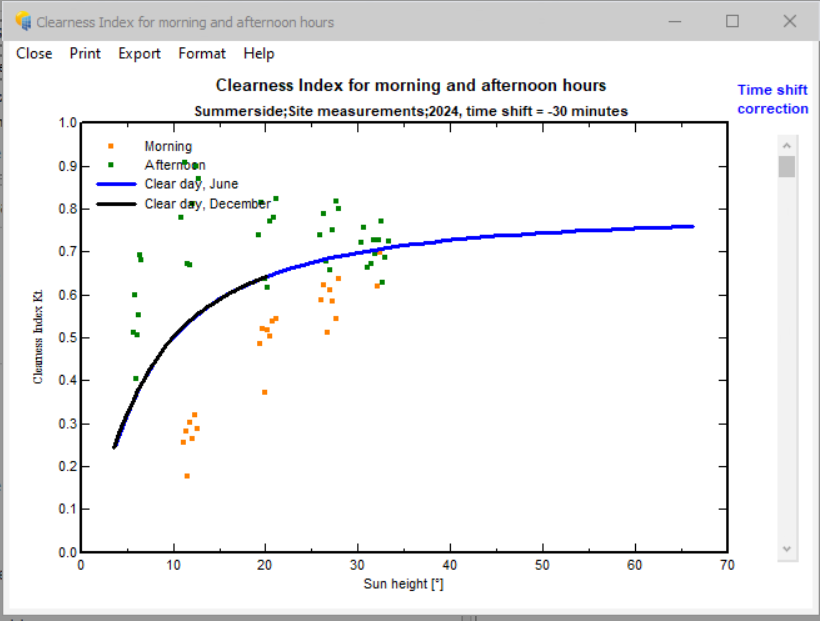
Hi Linda, Actually after deleting all the commons at the end of the CSV file, I was able to create .MET file. When I check the graphs of the data versus clear day model. I have best clear days ktcc within 10%, not every day is in within 5% as suggested in Weather data Note 6, I'm wondering if I can still use those days with a ktcc index higher than 5%? I'm also attaching the all other 3 graphs for reference. Thanks,
-
Thanks for the answer!
-
Getting error when trying to import Standard weather data file
Mike99 replied to Mike99's topic in Meteo data
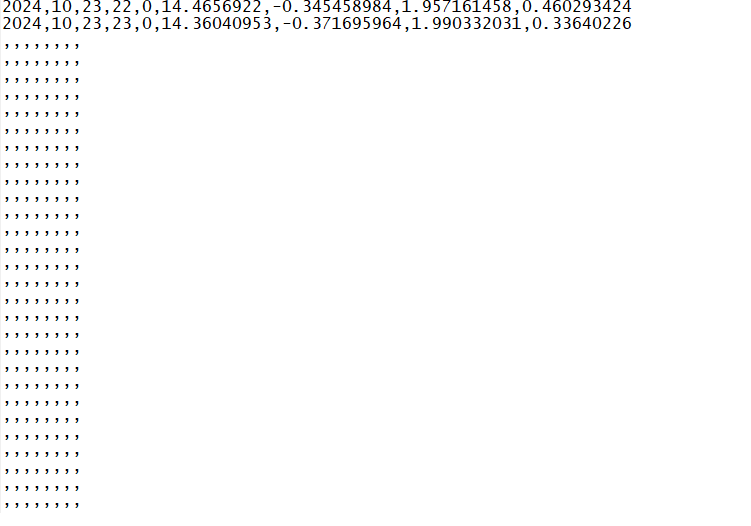
Just want to provide what is the last line in the CSV file. I have commas till the end of the file.
-
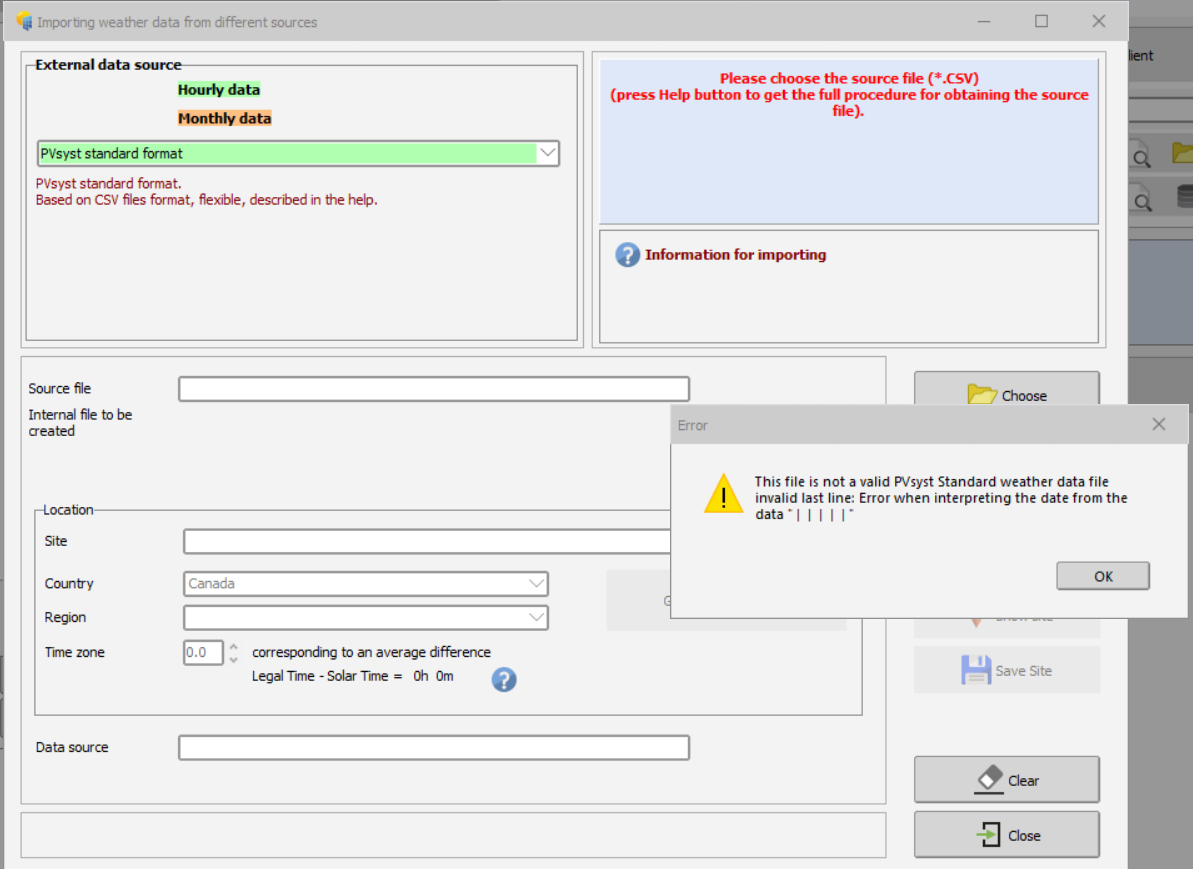
Hi, When I tried to import standard format CSV file into PVsyst, I'm getting the following error. Not sure what is the issue with my file. I'm saving the excel file as .CSV by using the save as option CSV(MS-DOS). Thanks,
-
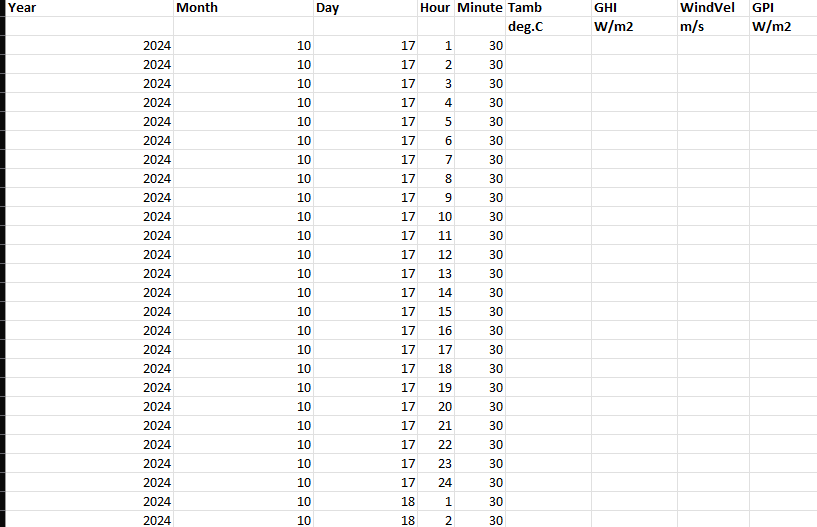
Hello PVsyst Team, I am trying to import a 7-day site weather measurement dataset into PVsyst. My measured weather data starts from 00:00 AM at the midnight of each day and runs all the way to 11:59 PM. I'm taking the average of the 60 data points for each hour and saving it as a middle point of that hour. For instance, for the average of 00:00AM to 00:59 AM data points I'm entering the average of it as 1:30 and for the next hour average I enter it as 2:30 and so on as per the snip below. Saving the measured data points in custom weather data format: 00:00 AM - 00:59 AM --> average of this goes into custom weather data as 1:30; 01:00 AM - 01:59 AM --> average of this interval goes into custom weather data as 2:30 ... 11:00 PM - 11:59 PM --> average of this interval goes into custom weather data as 24:30 I'm just wondering if this is the right way of mapping site measurement to create a custom weather data, since the time seems 1 hour off to me. Thanks,
-
Hello, I was wondering if there is any technical manual/doc that describes the the mathematical theory behind the PVsysty simulation. Especially, I'm curios about whether the simulation uses regression method in power output calculations? Thanks,
-
I'm trying to do PV system capacity test, and in my real measurement data I do have front and back irradiance measurements, so I am trying to match what I have from actual measurements to PVsyst model, in this case I believe I need GlobBak which has had shading applied. Just another question on how I can extract the GlobBak data when I extract the weather data from PVsyst, it seems it is not in my export at the moment. I am not able to see it under Data display and verification->Tables->Variables. Thanks,
-
Thanks for the answer Dtrain, my system is actually having bifacial modules, how can I get the total irradiance from this raw data? Does POA actually equals to front POA+ rear POA, or there is an equation to get overall POA for bifacial systems?
-
Hi everyone, I'm just trying to understand which irradiance value is actually representing the POA irradiance from the simulation result raw data below. Is it GlobInc column or I need to calculate it? date GlobInc GlobEff EArray E_Grid PR GlobHor DiffHor T_Amb WindVel BeamHor W/m² W/m² kW kW ratio W/m² W/m² °C m/s W/m² 01/01/90 00:00 0 0 0 -29.764 0 0 0 -4.6099 3.5 0 01/01/90 01:00 0 0 0 -29.764 0 0 0 -4.6903 2.9 0 01/01/90 02:00 0 0 0 -29.764 0 0 0 -5.2298 2.5999 0 01/01/90 03:00 0 0 0 -29.764 0 0 0 -5.5203 2.9 0 01/01/90 04:00 0 0 0 -29.764 0 0 0 -5.8099 2.7999 0 01/01/90 05:00 0 0 0 -29.764 0 0 0 -6.1004 3.1 0 01/01/90 06:00 0 0 0 -29.764 0 0 0 -6.3097 2.7 0 01/01/90 07:00 0 0 0 -29.764 0 0 0 -6.5197 3.5 0 01/01/90 08:00 12.703 8.0465 231.68 87.673 0.2641 14.806 14.797 -6.1696 3.1 0.0094 01/01/90 09:00 245.44 118.33 2798.4 2710.9 0.4226 112.3 63.302 -4.9298 4.5999 48.996 01/01/90 10:00 256.56 149.41 3831.8 3733 0.5567 165.99 127.2 -4.08 4.1 38.796 01/01/90 11:00 287.94 177.34 4592.7 4484.7 0.5959 196.1 156.2 -3.4696 3.9 39.908 01/01/90 12:00 245.12 152.5 4208.2 4105.1 0.6408 184.8 157.5 -3.1903 4.3999 27.303 01/01/90 13:00 267.76 162.32 4249.2 4145.6 0.5924 181.7 145.2 -3.0303 4.9 36.502 01/01/90 14:00 207.67 118.55 3201.4 3109.7 0.5729 137.39 113.2 -3.1099 4.1 24.195 01/01/90 15:00 108.34 53.481 1474.8 1371 0.4842 66.401 57.002 -3.5802 5.7 9.3984 Any help would be appreciated, Thanks,