

Mark.Norman
-
Posts
6 -
Joined
-
Last visited
Posts posted by Mark.Norman
-
-
-
Hi
Firstly, please note all my designs are in the southern hemisphere.
I have a design where I have:
- laid out the modules for each MPPT within the “Module Layout” tab such that PVsyst can calculate the electrical mismatch losses, and
- created a “Near Shading” model.
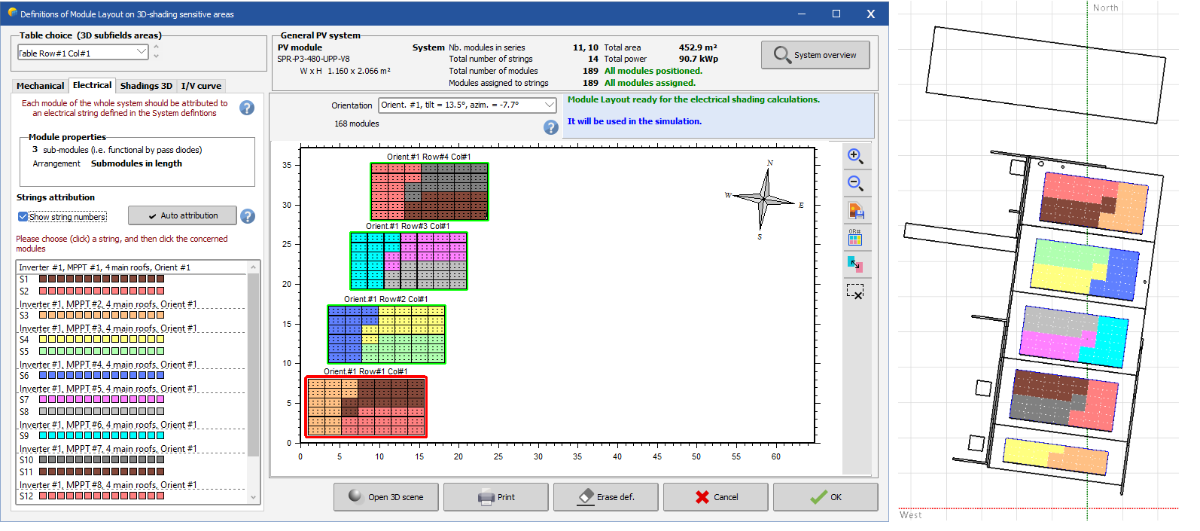
However, the graphical module locations in the “Module Layout”, relative to the “Near Shading” model are rotated by 180 degrees, as defined by each diagram’s cardinal direction pointers. It seems the cardinal pointer in the “Module Layout” is flipped by 180 degrees? For example, when I run the “Module Layout” shadings animation, the western modules are shaded in the morning and the eastern in the afternoon, as indicated by the cardinal direction pointer in the diagram. (see attached video)
Please see the attachments
- 1.png – comparison of layout from “Near Shading” and “Module Layout”
- 2.mp4 – Shadings animations video
I assume the only problem is that the cardinal pointer on the “Module Layout” diagram is flipped by 180 degrees and all the underlying calculations are all correct?
For now, I have assumed this is the case and flipped my strings.
Thank you very much.

-
Hi
I havd exactly the same requests. Can PVsyst please add Huawei optimisers?
Thank you
-
Hi
If storage is defined within a project variant, does the aging tool calculate the loss for both the PV module and battery degradation, or just for the modules?
If just for the modules, how can I include the effects of battery degradation? For example, do I have to set the SOWCycl and SOWStat and module degradation year manually and run each consecutive year, for example as a separate variant? Or else, can this be done via batch processing?
Thank you in anticipation.
Mark
Possible error in hourly output file E_Avail = EDirUse and EAvailB > E_Avail PVsyst 7.4.4
in Problems / Bugs
Posted
Hi
Possible error in hourly output file E_Avail = EDirUse and EAvailB > E_Avail. Does not seem to be correct, or I am misunderstanding?
Blue cells are summed columns.
The rest of the data seems correct