smeredith
Members-
Posts
24 -
Joined
-
Last visited
-
After posting this, I realized the documentation may be referring to the saturation current evaluated at the actual cell temp, rather than the reference value. Is that the case?
-
In PVsyst's documentation, it's stated that due to computational problems, PVsyst requires that the saturation current of a module at STC (I0_ref) be at least 0.01 pA, or 1e-14 A. However, after playing around with the single-diode parameters of modules in PVsyst, it seems like in reality the minimum saturation current of a module is 0.01 nA, or 1e-11 A. This is 1000 times greater than what is stated in the documentation. Is the value quoted in the documentation an error? Or is there something else going on here? Attached is a screenshot of the documentation text for reference.
-
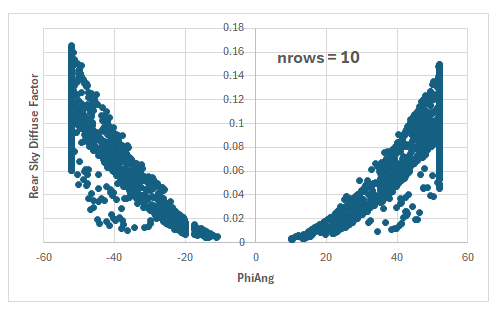
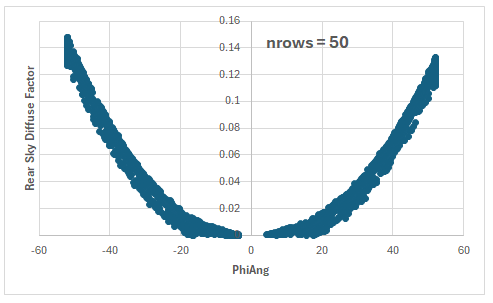
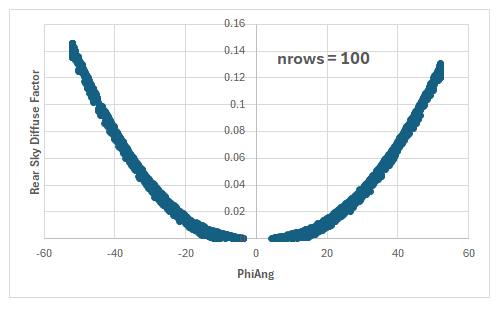
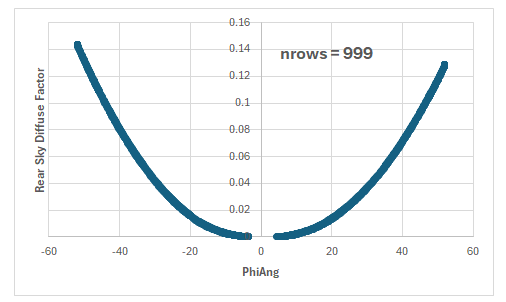
@Michele Oliosi Thanks for the response. I'd like to also add some observations about how this factor changes with number of rows. The fewer rows there are, the more "scattered" the factor is for both negative and positive PhiAng. See below some graphs generated in PVsyst 7.4.8. Though these were generated in v7, the scattering is also observing in v8. I'd like to know what's causing the scattering and if this is intentional.
-
Resurrecting this thread since I've noticed the same thing happening in PVsyst v8. The main difference between v7 and v8 seems to be that circumsolar is separated from the rear sky diffuse in v8, regardless of whether the user chooses the setting that separates it from the diffuse or includes it.
-
For anyone wondering, it appears that this bifurcation is a result of soiling, since it disappears when soiling is set to 0% for each month. That said, it is still a mystery to me exactly how soiling values are affecting IAM.
-
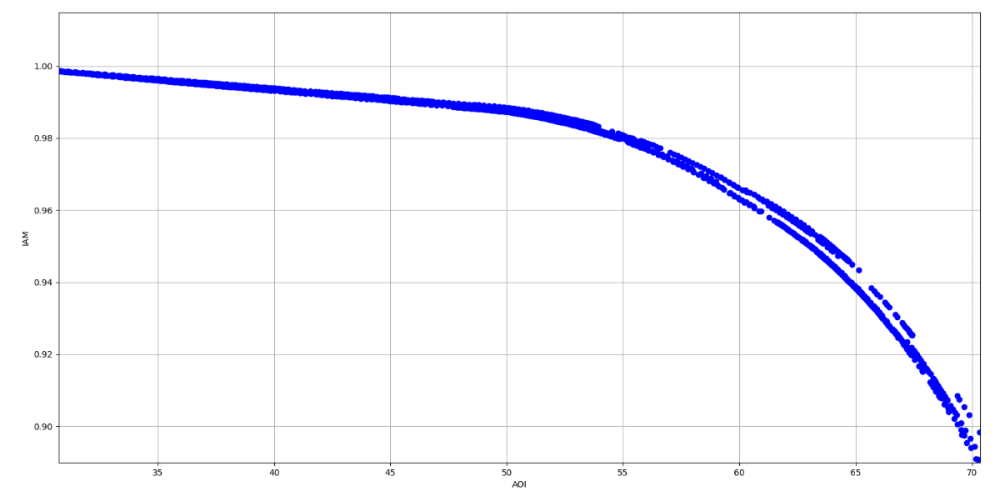
Recently, I calculated the IAM beam factors for each hour of a fixed-tilt 8760, as 1 - IAMBLss/(BeamInc - ShdBLss). The project was modeled in PVsyst 8.0.7 with the default parameter values for a Fresnel AR IAM curve. When I plotted IAM vs. AOI, I saw a curve that somewhat resembled the Fresnel curve - except that there were significant bifurcations. See the attached image. As far as I can tell, this seems to be a "feature" of PVsyst 8, as the same bifurcations do not exist when I run the project in 7.x.x. What is the reason for this? This seems to be non-ideal behavior.
-
I have noticed when modeling systems using SolarEdge architecture that the SolarEdge inverter efficiency (and overall, the system energy) doesn't change when the strings are configured differently - as long as the total number of strings of each string length remains the same. As an example, compare the two variants below. Simulation A: Subarrays: Subarray 1: SE 33.3k inverter with 24 modules per string, 45 strings in parallel Subarray 2: SE 33.3k inverter with 22 modules per string, 45 strings in parallel String configuration: 10x inverters with 3 strings of 24 mods/string and 0 strings of 22 mods/string 10x inverters with 0 strings of 24 mods/string and 3 strings of 22 mods/string 5x inverters with 2 strings of 24 mods/string and 1 string of 22 mods/string 5x inverters with 1 string of 24 mods/string and 2 strings of 22 mods/string Results: Inverter efficiency loss: -1.77% Yield: 1944.584 MWh Simulation B: Subarrays: Subarray 1: SE 33.3k inverter with 24 modules per string, 45 strings in parallel Subarray 2: SE 33.3k inverter with 22 modules per string, 45 strings in parallel String configuration: 15x inverters with 2 strings of 24 mods/string and 1 string of 22 mods/string 15x inverters with 1 string of 24 mods/string and 2 strings of 22 mods/string Results: Inverter efficiency loss: -1.77% Yield: 1944.584 MWh Although both simulations have a total of 45 strings of 24 mods/string and 45 strings of 22 mods/string, the string configurations are quite different. Because the inverter loading is different, I would expect the overall efficiency loss to be different. Yet when I run the simulations, I see that the efficiency loss and yields are identical. Is this intended behavior? If so, why?
-
SolarAnywhere v3.8 wind speed import error
smeredith replied to Allison Mueller's topic in Problems / Bugs
Just an FYI for others - I tried importing a SolarAnywhere 3.6 TGY file recently in PVsyst 7.2 and had a problem as well. It seems that SolarAnywhere recently changed the column header of the windspeed variable from "WindSpeed (m/s)" to "Wind Speed (m/s)". Note the addition of the space. When I imported a file with the new convention, PVsyst didn't recognize the name of the windspeed column (rightfully so), and so windspeed for me became all zeros for the year. This became problematic when I ran simulations, since I typically use a non-zero value for the wind component of the thermal loss factor (Uv). Based on what the OP mentioned about SA 3.8 having issues - my guess is that CPR changed the windspeed naming convention for all of their products. -
Threshold loss when array power > inverter threshold
smeredith replied to smeredith's topic in Simulations
FYI I think this threshold loss is based on minimum current. Several simulations that I've run show a threshold loss below a certain minimum IArray. What that IArray is, however, remains a mystery. Just frustrating that PVsyst's behavior is unexpected and doesn't follow its own documentation. -
I ran a simulation and noticed that there are certain hours where the inverter is flagged as offline and the power loss is assigned to the "IL_Pmin" category, which is supposed to be because array power is below the threshold of the inverter. However in my case, for the hours that are lost due to inverter threshold, the input power is actually 5-6x the inverter threshold. This is sort of a "double whammy", because not only are those lost production hours, but there is also nighttime inverter loss associated with these hours. See the below example, in which an inverter with a 2500 W (2.5 kW) threshold is losing power. For reference, just a single central inverter (2200 kW) is being used for this project. Power units are in kW. Can someone explain why this is happening? The result is a lower yield than I would expect.
-
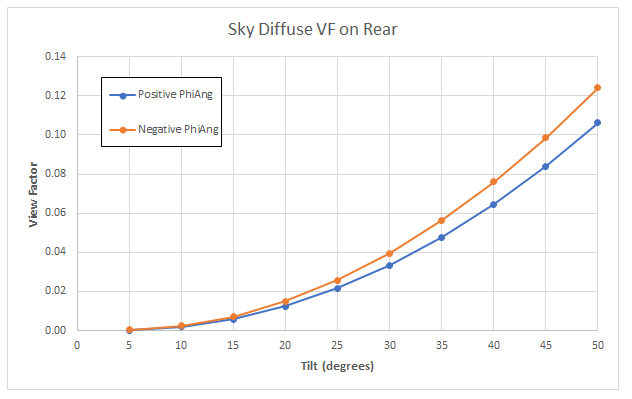
This was calculated from the 8760 CSV. Before running the simulation, I changed the circumsolar calculation to be included in the diffuse component in order to get a more accurate calculation of the rear sky diffuse factor, as I understand that it is by default removed from the diffuse component and added to the direct component. Then I calculated the rear sky diffuse factor as DifSBak/DiffHor, and plotted the view factors for both positive and negative PhiAng. The above graph is the result of that.
-
Does anyone from PVsyst have thoughts on this? Is this a bug or intended behavior?
-
I noticed something about bifacial simulations for trackers that I think is an error. If you calculate the sky diffuse view factor on the rear side, you'll notice that the view factor is different depending on whether the module has a positive or negative tilt (PhiAng). Below is a graph showing the view factor as a function of tilt for GCR = 0.5. As you can see, the view factor is always higher for negative tilts compared to positive tilts. This behavior seems to be consistent across all GCRs. I was wondering if this was intended behavior or if this is an error - to me, it doesn't make sense that the view factor would be different depending on if the tracker was facing east or west.
-
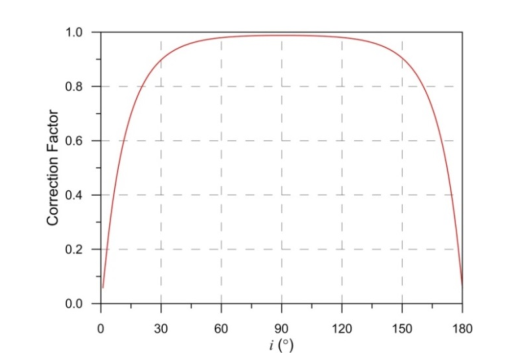
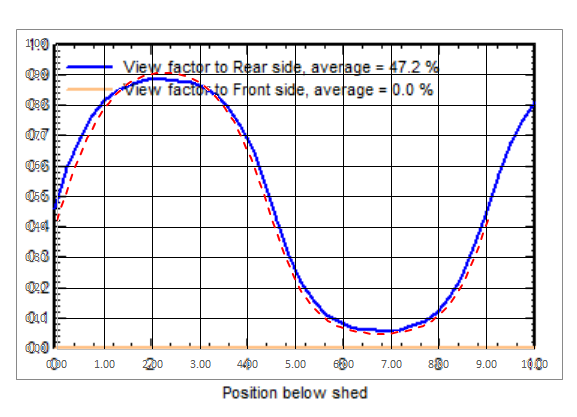
Hi, I've been comparing the rear irradiance model published by Marion et al. ("A Practical Irradiance Model for Bifacial PV Modules", 2017) to the PVsyst 2D bifacial model. There are some differences, such the fact that PVsyst doesn't include irradiance reflected from the front of a row to the rear of another row, and the fact that the Marion model considers 1-degree slices of surface (ground, sky, or module row) instead of discrete ground points when calculating view factor and IAM factors. One difference I'm trying to understand is the diffuse IAM correction factor as a function of ground point. Marion prescribes an IAM correction factor curve as a function of one degree surface slice, shown below. When using the values from this curve I obtain a view factor profile that is similar to, but noticeably different from, the profile shown in PVsyst. Below is a PVsyst view factor profile for a system with zero degree tilt, 0.5 GCR, and 1 m height (blue curve), overlaid with one calculated using the Marion correction factors from the curve above (red dashed line). The curves are similar but noticeably different. I was wondering how PVsyst is calculating the IAM correction factors that are used, as they appear to be different from what was derived from Marion et al.
-
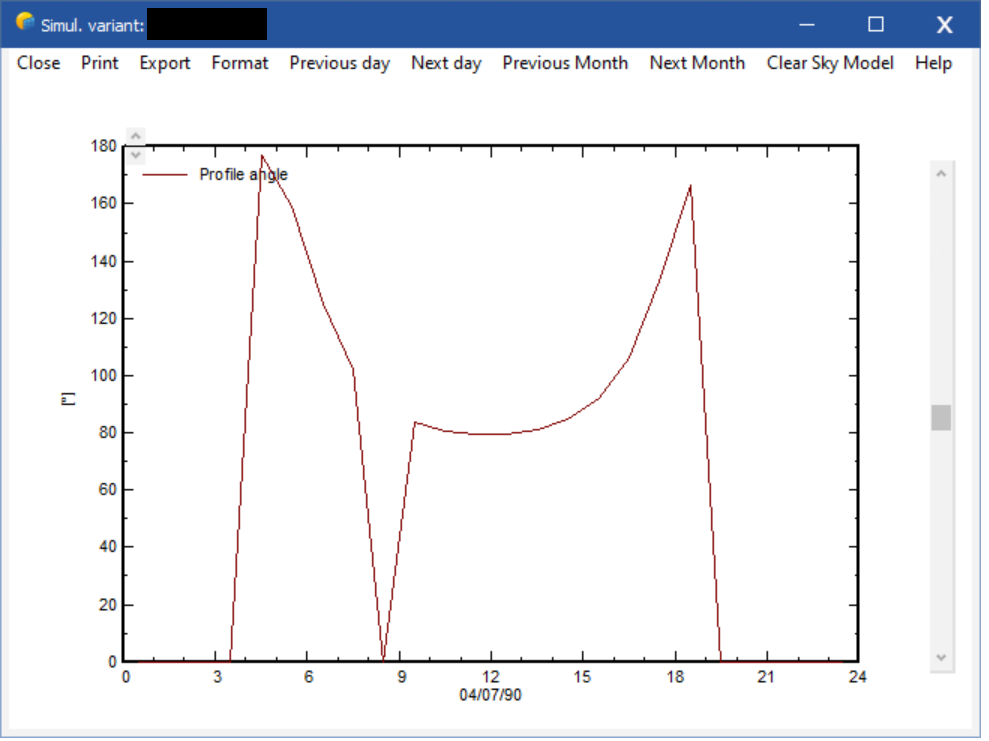
Hi, I am running PVsyst 7.2.10. I'm encountering an error which I'm not sure has been fixed in later versions, but I wanted to make you aware of it regardless. When running a fixed-tilt simulation, on a specific day the profile angle is going to zero at a time when the irradiance is not zero. Perhaps not coincidentally, at this time the sun azimuth is exactly -90 degrees (I have also seen profile angle going to zero when sun azimuth is exactly +90 degrees). This is causing the energy production to be much lower than it should be at this hour. The array is fixed tilt, with a tilt of 25 degrees and an azimuth of 0 degrees (directly South). See the screenshot below:


