


Paul
-
Posts
2 -
Joined
-
Last visited
Posts posted by Paul
-
-
Hello everyone,
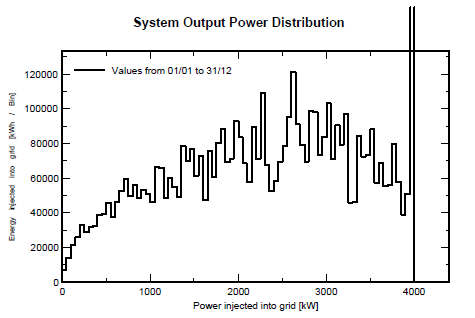
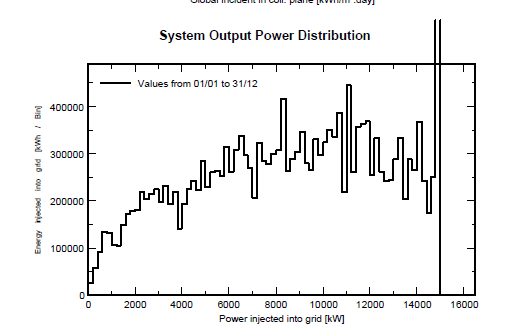
I have a question regarding several PVsyst result graph values (System output Power Distribution). As you can see on the images, the values are unusully high at the end of the graph and I really dont know the reason for that. It does not seem to me very logical that those values are sometime 2-3 times higher than the rough average values of the graph. Is this a serious simulation mistake?
Thanks for your help in advance!
Paul


System Power Output Graph Irregular High values
in Simulations
Posted
Hello all,
I recently noticed that, despite no simulation error occurred, the system power output graph showed some irregular high values (see attachment).
Is that normal or some kind of bug/simulation mistake?
Best regards
Paul