


juanval8586
-
Posts
3 -
Joined
-
Last visited
Posts posted by juanval8586
-
-
Hello.
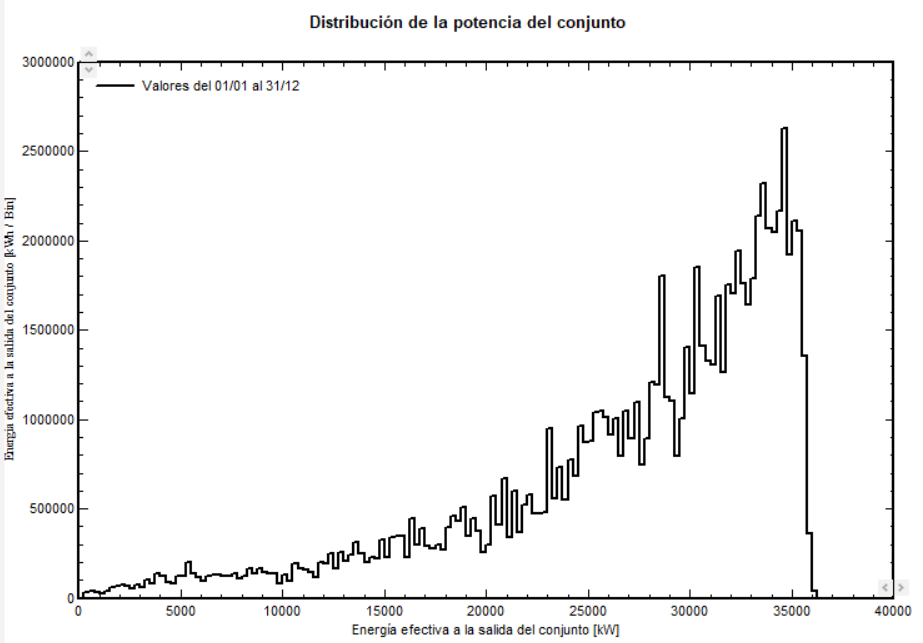
Someone could explain to me why the "System output power distribution graph" in some cases has a significant variation between nearest values of the power injected into the grid?

for example why it could have peak values at 30MW and then at 31MW it could have a lower value?
Thanks!
-
Hello.
After upgrading PVsyst to version 7.2.4 I began to have a problem with the reports, now it takes more time than before (7.2.3) to generate the reports (mostly in "savnig file") and when I tried to edit the Cover Page or edit the options of the report it automatically presents ERROR.
I attached the problem report from PVsyst.
Thanks!
Please Help :(
Access Through Remote Desktop
in Suggestions
Posted
Can you help me please? :roll: